Free Access
Fig. 2.
Download original image
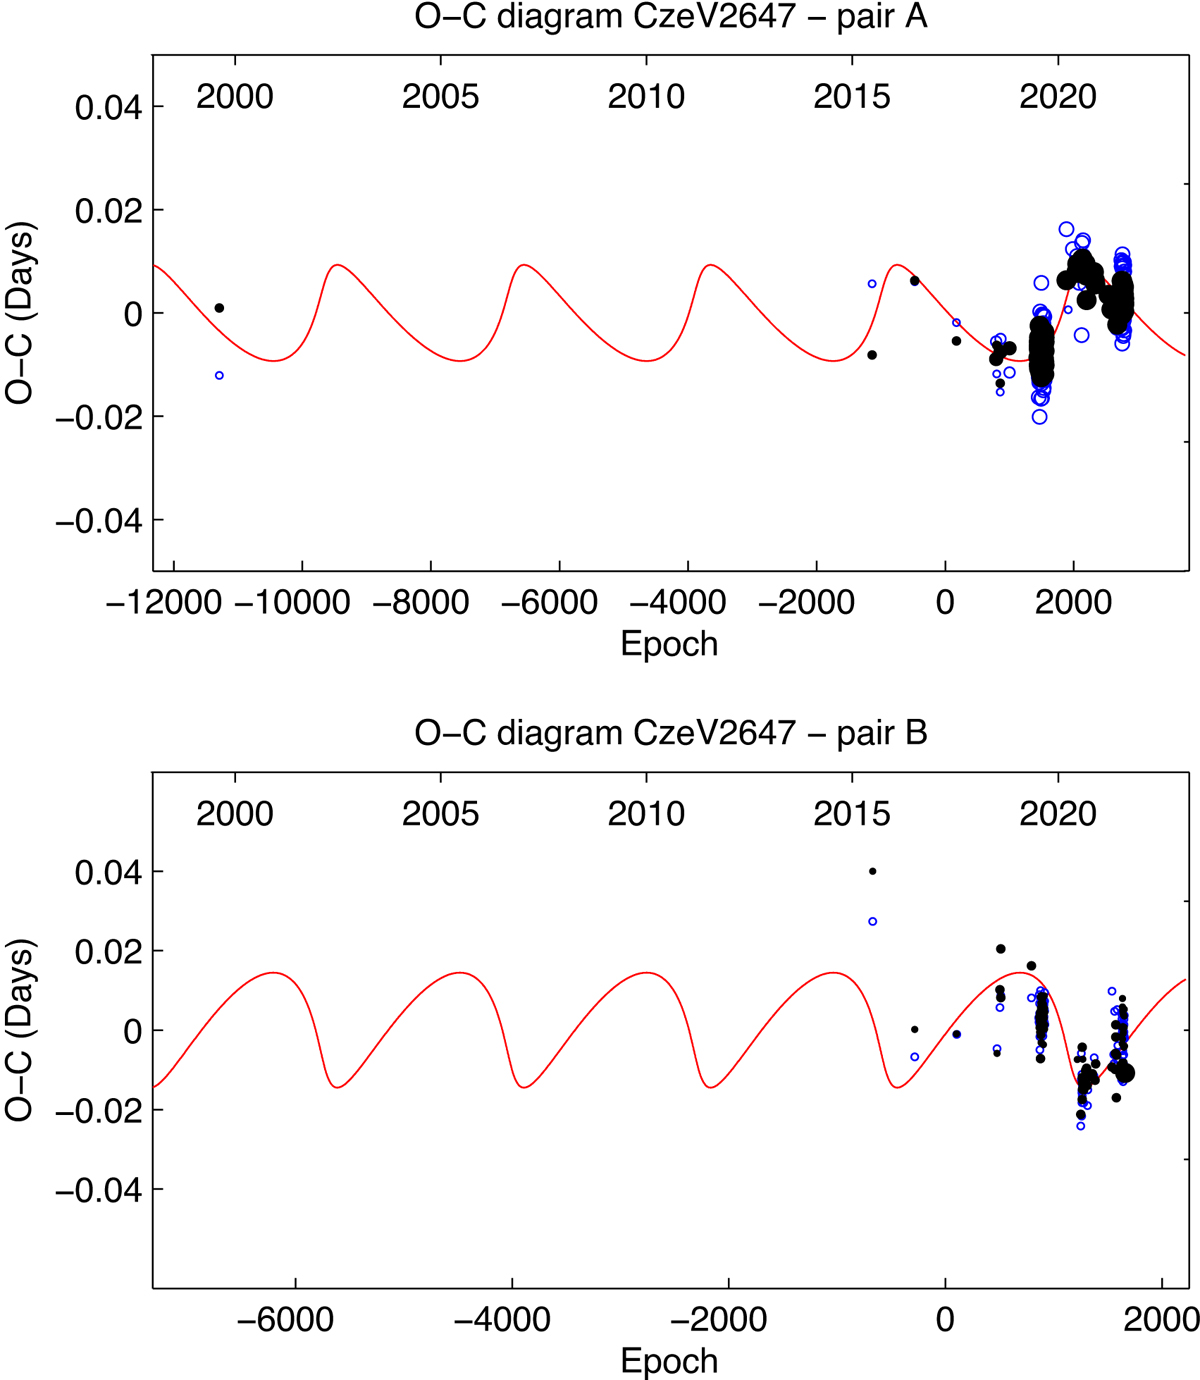
ETV diagram of CzeV2647 showing two sets of eclipses of A and B pairs as resulting from our analysis. Theoretical curve representing the fit given in Table 3 is plotted as a red solid curve, while the black dots stand for primary eclipses and the open circles for secondary ones: the larger the symbol, the higher the weight.
Current usage metrics show cumulative count of Article Views (full-text article views including HTML views, PDF and ePub downloads, according to the available data) and Abstracts Views on Vision4Press platform.
Data correspond to usage on the plateform after 2015. The current usage metrics is available 48-96 hours after online publication and is updated daily on week days.
Initial download of the metrics may take a while.