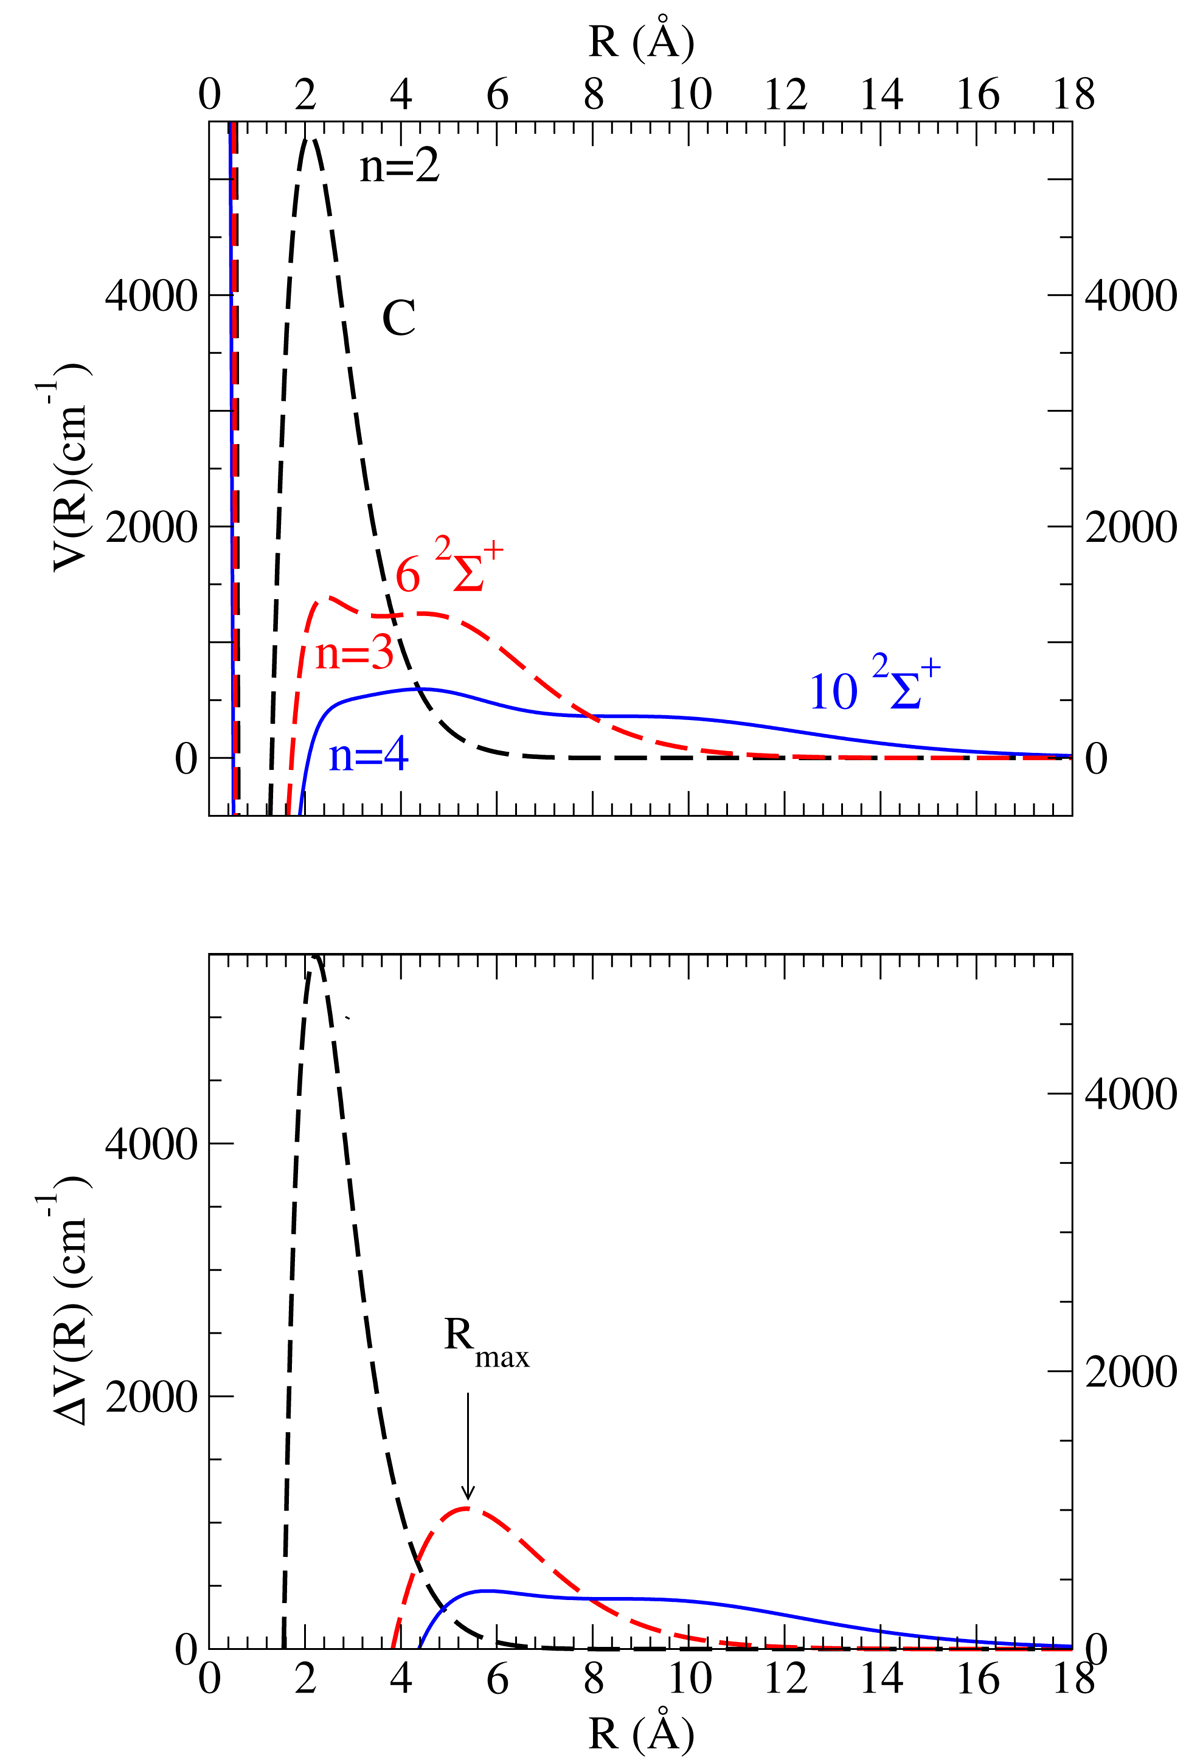
Fig. 4.
Download original image
Repulsive potentials and their difference. Top: potential energy V of the repulsive states of Lyman-α (dashed black curve), Balmer-α (dashed red curve), and Balmer-β (blue curve). Bottom: difference potential ΔV(R) for the Lyman-α transition X → C (dashed black curve), for the Balmer-α transition C → 62Σ+ (dashed red curve), and for the Balmer-β transitions C → 102Σ+ (blue curve).
Current usage metrics show cumulative count of Article Views (full-text article views including HTML views, PDF and ePub downloads, according to the available data) and Abstracts Views on Vision4Press platform.
Data correspond to usage on the plateform after 2015. The current usage metrics is available 48-96 hours after online publication and is updated daily on week days.
Initial download of the metrics may take a while.