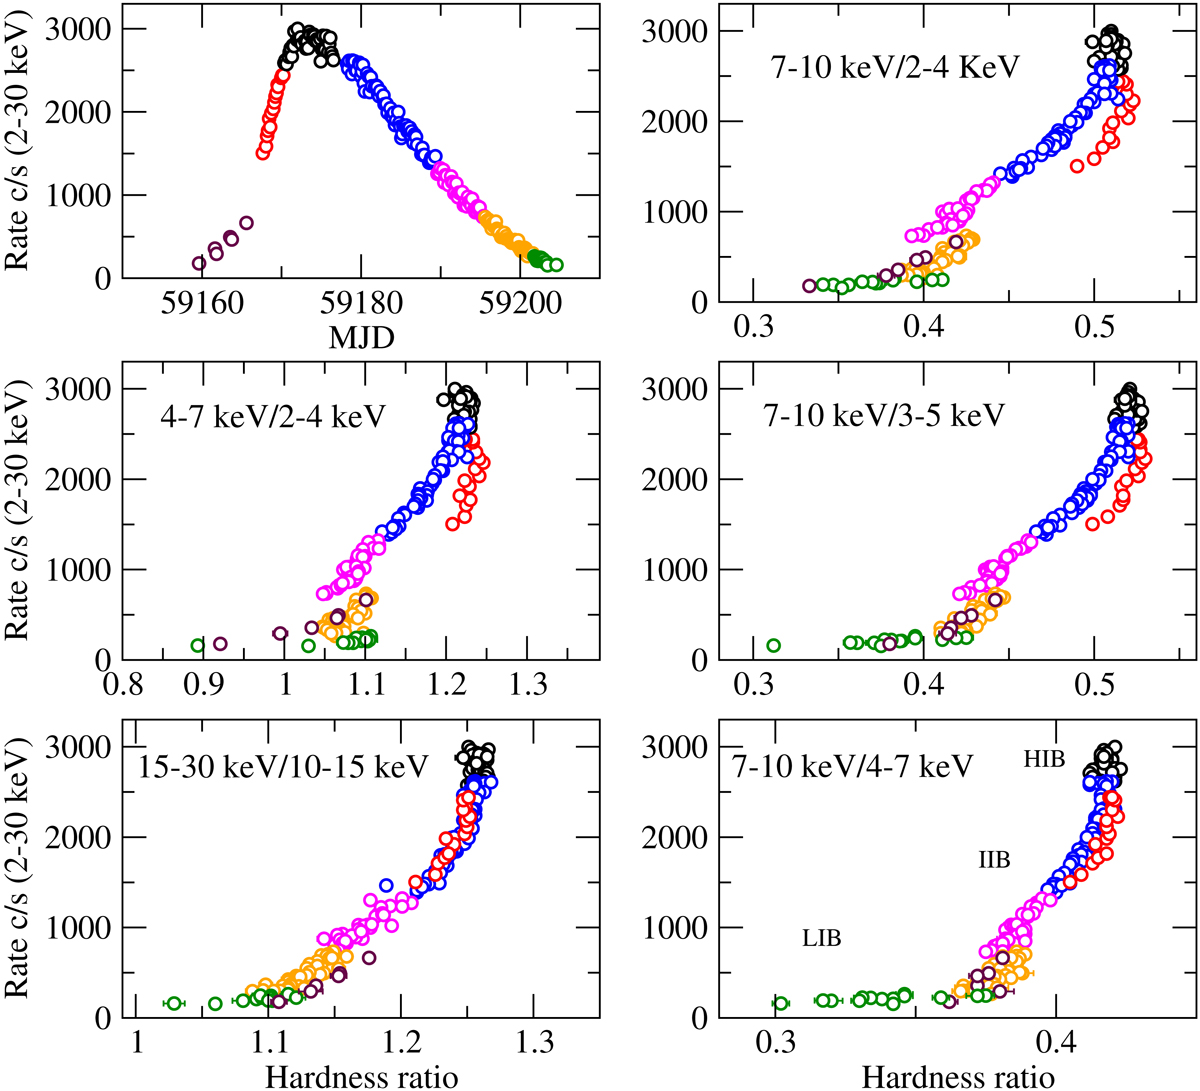
Fig. 1.
Download original image
Outburst light curve and HIDs for various hardness ratios, shown in the top-left corner of each diagram. Different colors represent different instances of the outburst as shown in the light curve (top-left panel): brown and red circles correspond to the rise of the outburst, black points to the peak, and blue, magenta, orange, and green circles to the decay of the outburst.
Current usage metrics show cumulative count of Article Views (full-text article views including HTML views, PDF and ePub downloads, according to the available data) and Abstracts Views on Vision4Press platform.
Data correspond to usage on the plateform after 2015. The current usage metrics is available 48-96 hours after online publication and is updated daily on week days.
Initial download of the metrics may take a while.