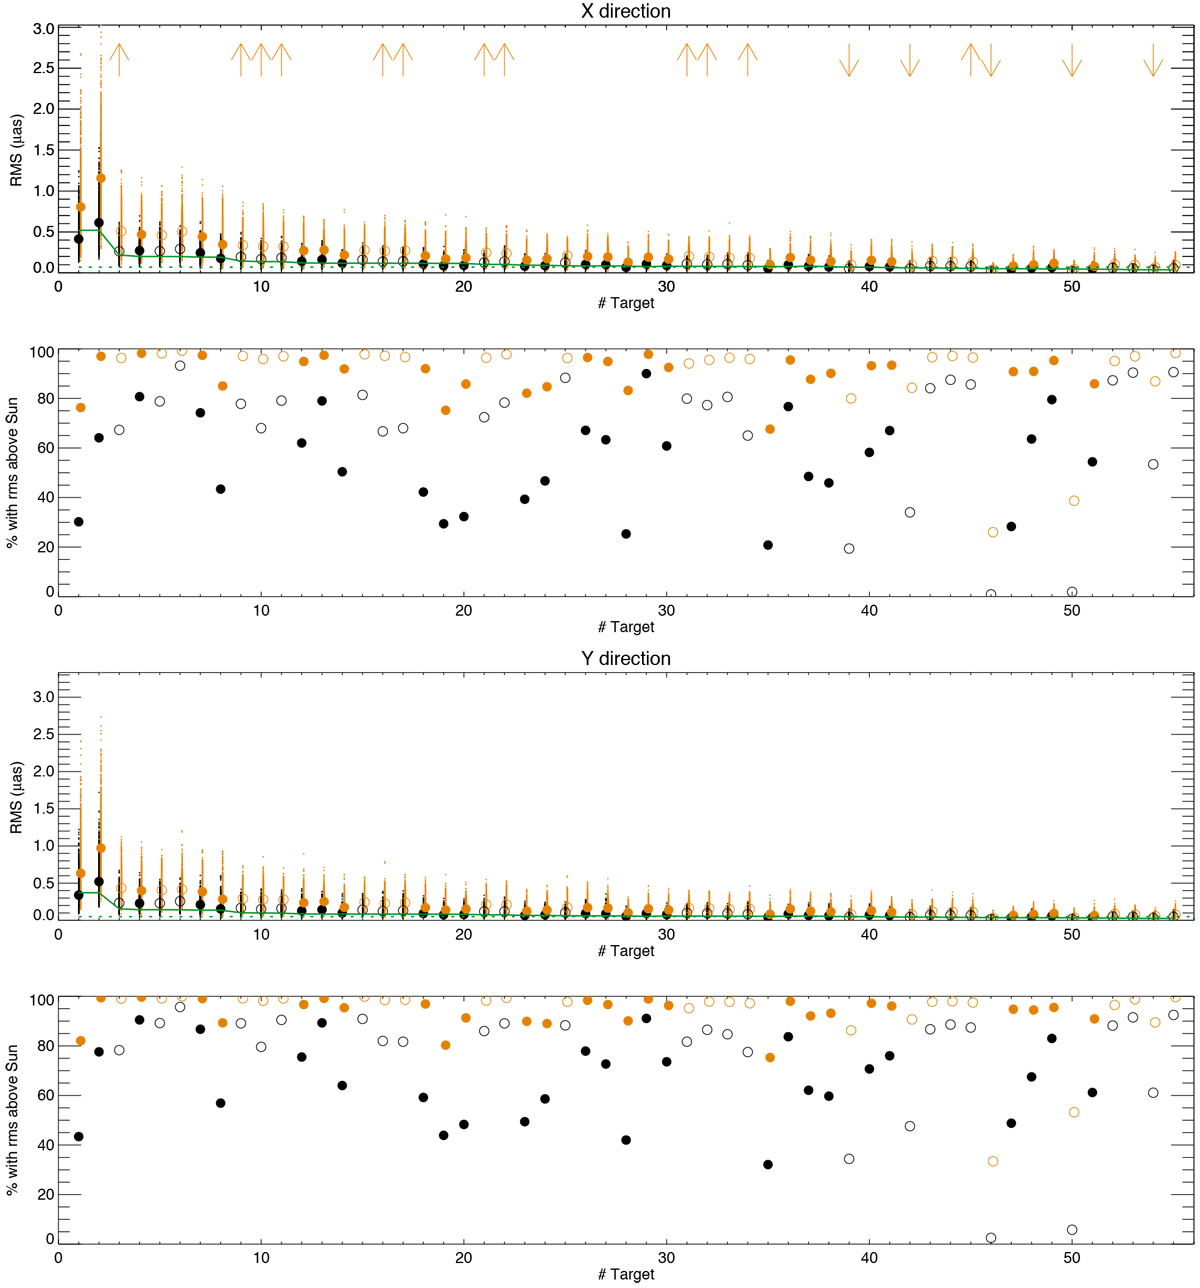
Fig. B.1
Download original image
Astrometric jitter and comparison to solar values. First panel: Astrometric jitter (rms) in the X direction, for ΔTspot1 (black dots) and ΔTspot2 (orange dots). The median values are indicated by circles of the same colour (open circles correspond to stars outside the B-V range of our simulations). The green lines correspond to the solar value from Lagrange et al. (2011) at 10 pc (dotted line)and scaled to the distance of each star (solid line). Upward arrows mean that the rms are lower limits (active stars), while downward arrows correspond to upper limits (quiet stars, mostly subgiants). Second panel: Percentage of simulations with rms larger than the solar values of Lagrange et al. (2011) scaled to the distance of each star, for ΔTspot1 (black) and ΔTspot2 (orange). Open circles correspond to stars outside the B-V range of our simulations. Third panel: Same as first panel for the Y direction. Fourth panel: Same as second panel for the Y direction.
Current usage metrics show cumulative count of Article Views (full-text article views including HTML views, PDF and ePub downloads, according to the available data) and Abstracts Views on Vision4Press platform.
Data correspond to usage on the plateform after 2015. The current usage metrics is available 48-96 hours after online publication and is updated daily on week days.
Initial download of the metrics may take a while.