Fig. 7
Download original image
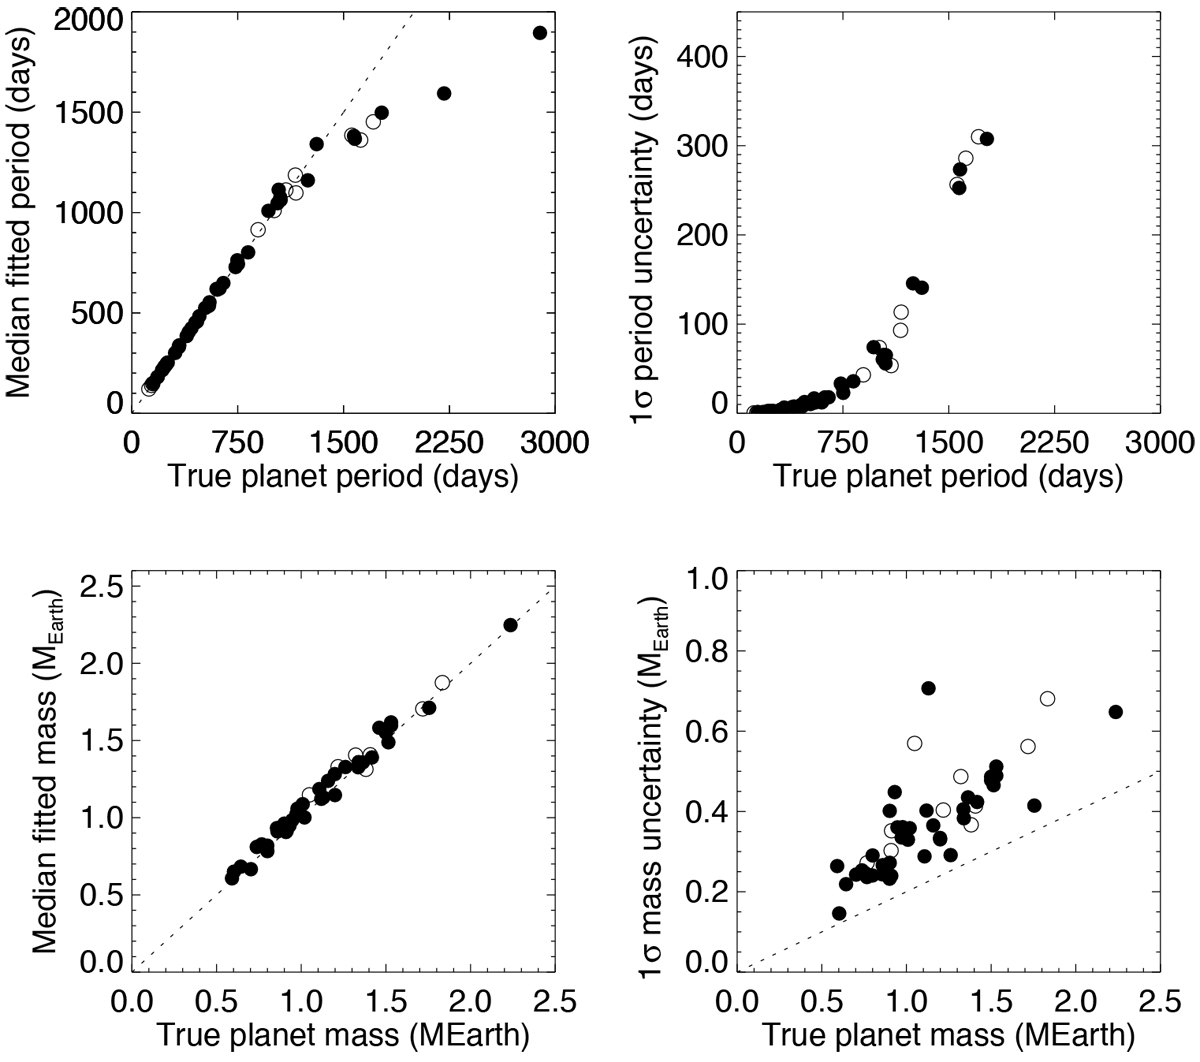
Properties of fitted periods (upper panels) and masses (lower panels) vs. true values for the masses the closest to the new detection limits from the blind test: median values (left panels, computed on all peaks above the fap, including the false positives, compared to the y = x dashed line), and 1σ uncertainties (right panels, the dashed line on the mass plot indicates a 20% uncertainty level). Open circles correspond to stars outside the B-V range of our simulations.
Current usage metrics show cumulative count of Article Views (full-text article views including HTML views, PDF and ePub downloads, according to the available data) and Abstracts Views on Vision4Press platform.
Data correspond to usage on the plateform after 2015. The current usage metrics is available 48-96 hours after online publication and is updated daily on week days.
Initial download of the metrics may take a while.