Fig. 6
Download original image
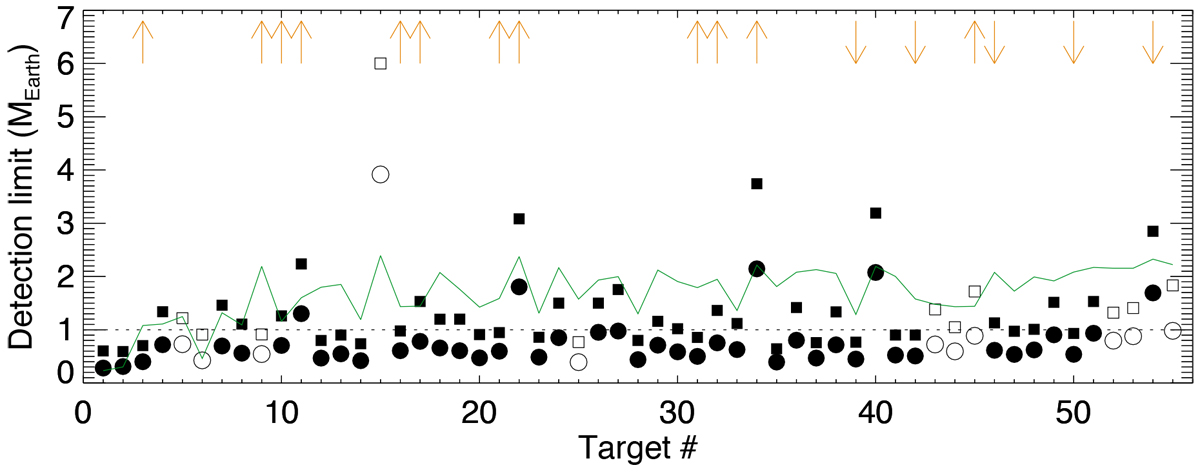
Detection limits vs. target number obtained with the blind test covering the whole habitable zone of each target and a random choice between ΔTspot1 and ΔTspot2. Circles are for a detection rate threshold of 50%, and squares for a detection rate threshold of 95%. Open circles correspond to stars outside the B-V range of our simulations. The green line is the detection limit obtained in Theia Collaboration (2017). Downward arrows mean that the detection limits are upper limits (quiet stars), while upward arrows correspond lower limits (quiet stars). Detection limits of 10 MEarth are lower limits (saturation of the detection rate curves, see Fig. D.1).
Current usage metrics show cumulative count of Article Views (full-text article views including HTML views, PDF and ePub downloads, according to the available data) and Abstracts Views on Vision4Press platform.
Data correspond to usage on the plateform after 2015. The current usage metrics is available 48-96 hours after online publication and is updated daily on week days.
Initial download of the metrics may take a while.