Fig. 5
Download original image
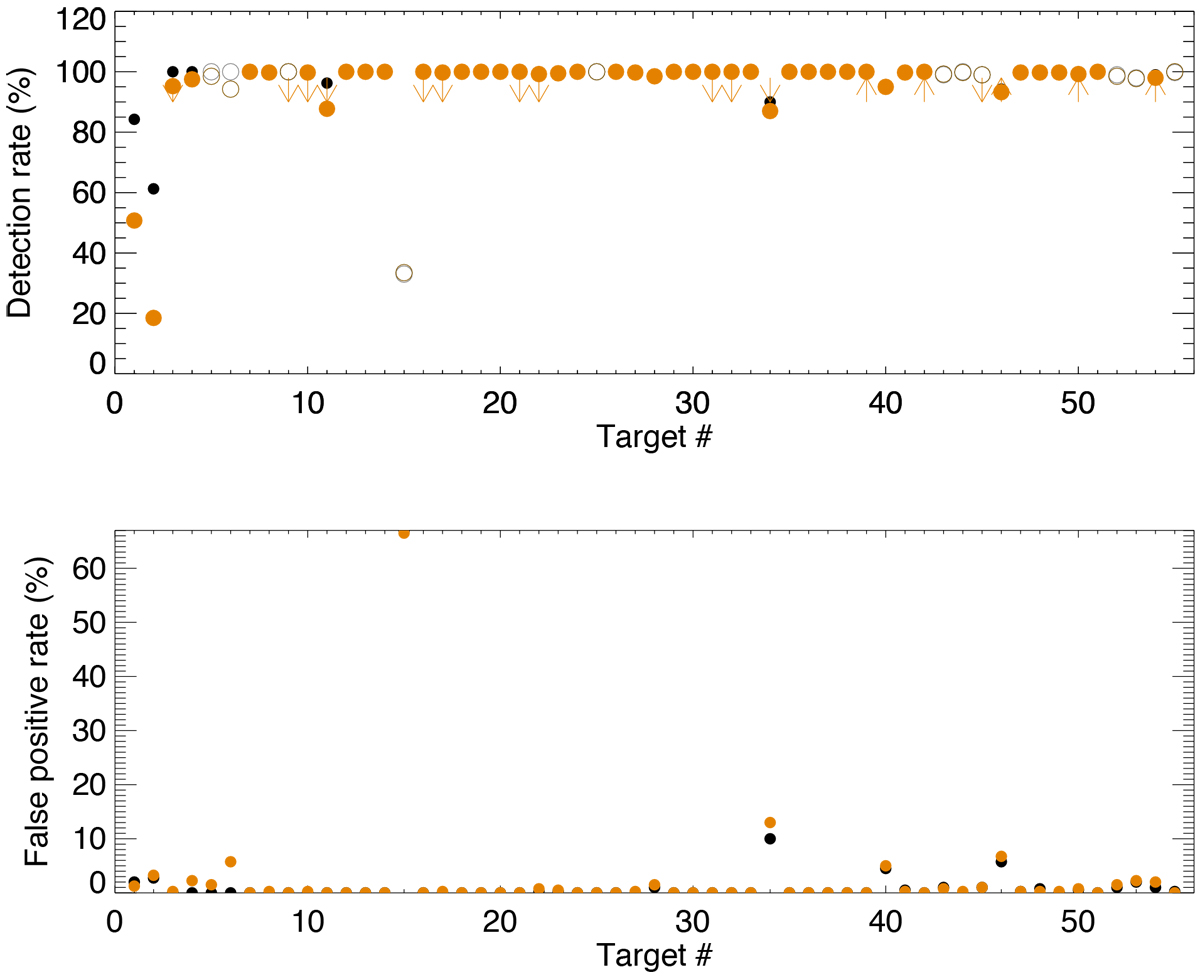
Detection rates (upper panel) and false positive rates (lower panel) vs. target number for a planet mass at the 6σ (according to their analysis) detection limit of Theia Collaboration (2017), for ΔTspot1 (black) and ΔTspot2 (orange), and for the blind test with a fap at 1%. Downward arrows mean that the detection rates are upper limits (active stars), while upward arrows correspond to lower limits (quiet stars, although most rates are already close to 100%). Open circles correspond to stars outside the B-V range of our simulations.
Current usage metrics show cumulative count of Article Views (full-text article views including HTML views, PDF and ePub downloads, according to the available data) and Abstracts Views on Vision4Press platform.
Data correspond to usage on the plateform after 2015. The current usage metrics is available 48-96 hours after online publication and is updated daily on week days.
Initial download of the metrics may take a while.