Fig. 3
Download original image
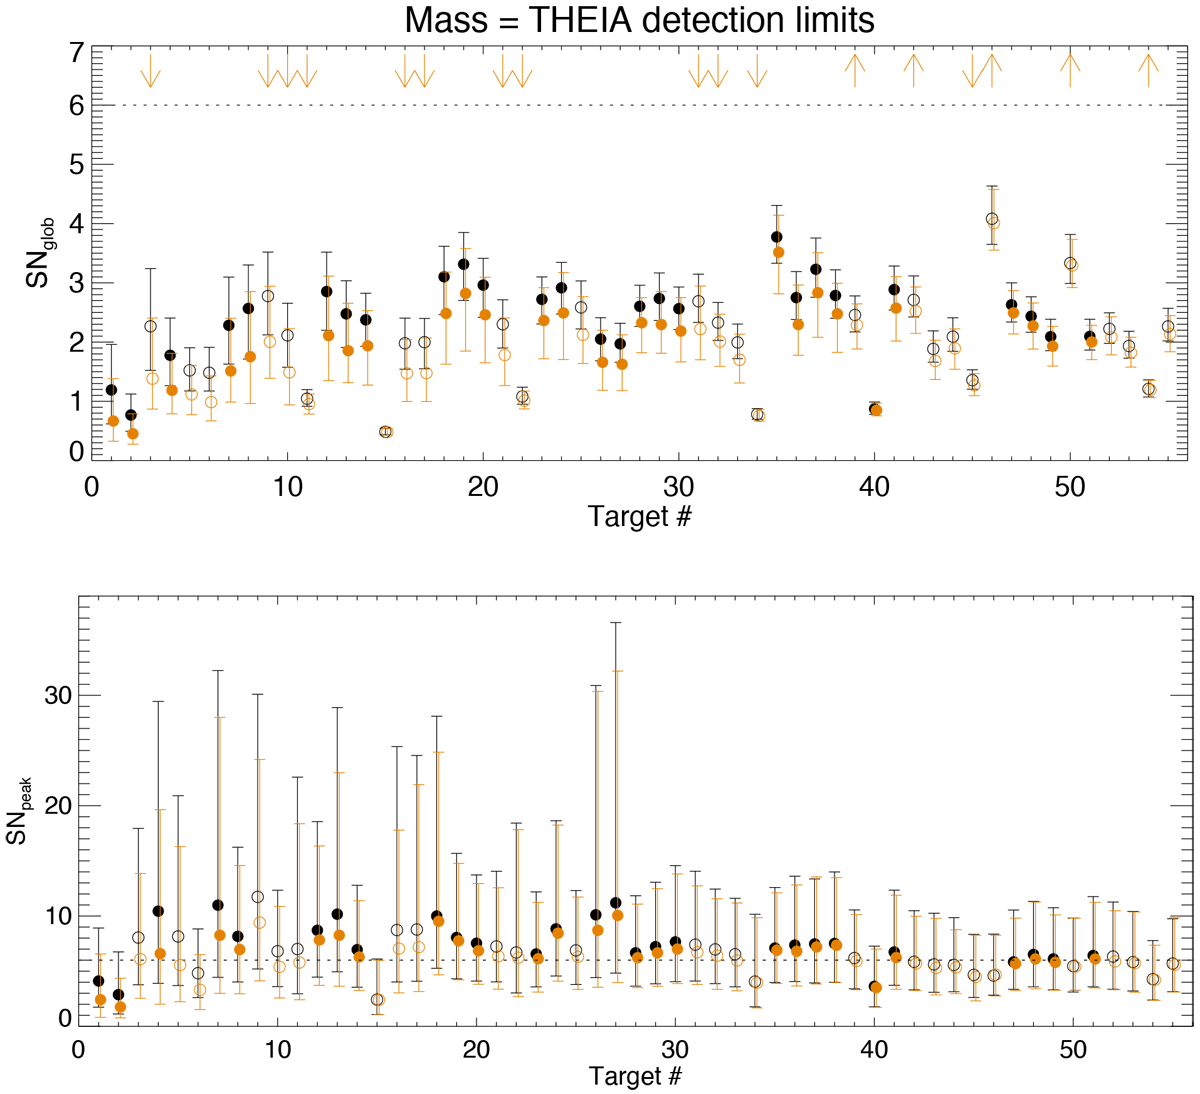
SNglob (upper panel) and SNpeak (lower panel, discussed in Appendix C.1) vs. target number, for planet masses at the detection limit of Theia Collaboration (2017), for ΔTspot1 (black) and ΔTspot2 (orange). The horizontal dotted line corresponds to a S/N of 6. Circles correspond to the median value for each star (open circles correspond to stars outside the B-V range of our simulations), while the errorbar symbols correspond to the 5th and 95th percentiles. Upward arrows mean that the S/N are lower limits (quiet stars), while downward arrows correspond to upper limits (active stars).
Current usage metrics show cumulative count of Article Views (full-text article views including HTML views, PDF and ePub downloads, according to the available data) and Abstracts Views on Vision4Press platform.
Data correspond to usage on the plateform after 2015. The current usage metrics is available 48-96 hours after online publication and is updated daily on week days.
Initial download of the metrics may take a while.