Fig. D.3
Download original image
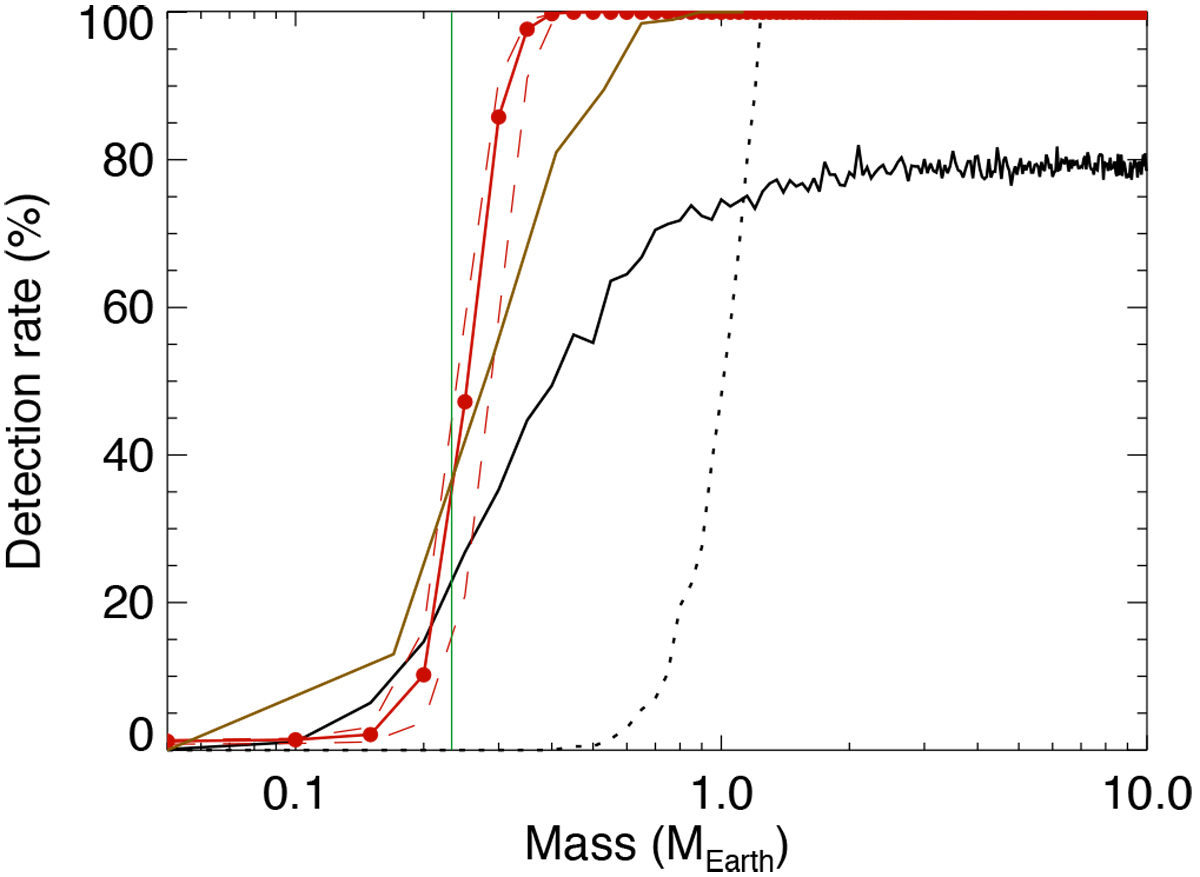
Example of detection rates vs. mass for α Cen A for different definitions: blind test with a fap threshold of 1 % (brown, all ΔTspot, see Sect. 4), SNpeak > 6 (solid black line, ΔTspot1, see Appendix D.1), SNglob > 6 (dahed black line, ΔTspot1), and theoretical false positive of 1% (in red, ΔTspot1, see Appendix D.2). The dashed red line indicates the uncertainty on the red solid curve. The vertical green line is the detection limit obtained in Theia Collaboration (2017).
Current usage metrics show cumulative count of Article Views (full-text article views including HTML views, PDF and ePub downloads, according to the available data) and Abstracts Views on Vision4Press platform.
Data correspond to usage on the plateform after 2015. The current usage metrics is available 48-96 hours after online publication and is updated daily on week days.
Initial download of the metrics may take a while.