Open Access
Fig. D.1
Download original image
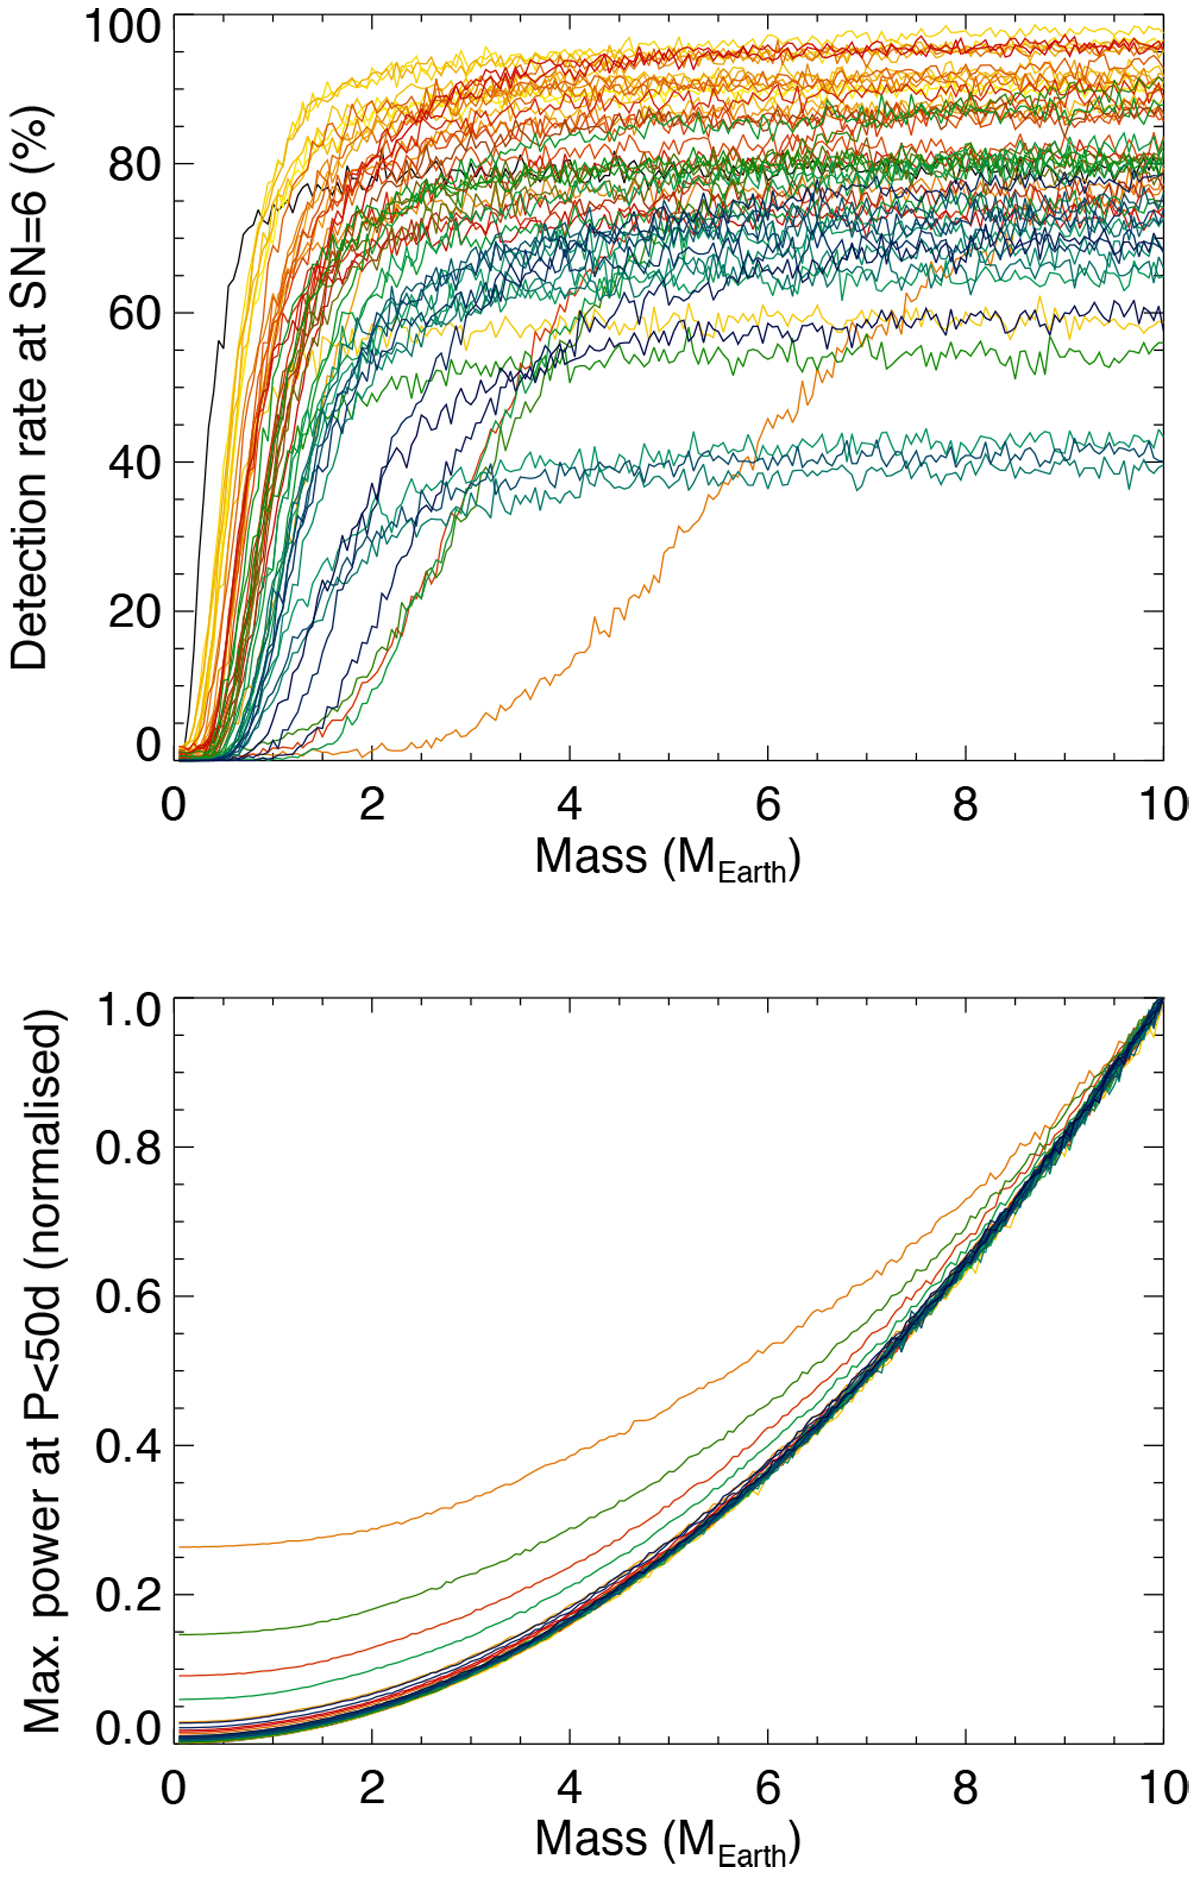
Detection rates for SNpeak > 6 versus planet mass (upper panel) for all stars (one curve per star, arbitrary colours). The lower panel shows the maximum power for periods below 50 days vs. planet mass for all stars (arbitrary colours), after normalisation to a maximum of 1.
Current usage metrics show cumulative count of Article Views (full-text article views including HTML views, PDF and ePub downloads, according to the available data) and Abstracts Views on Vision4Press platform.
Data correspond to usage on the plateform after 2015. The current usage metrics is available 48-96 hours after online publication and is updated daily on week days.
Initial download of the metrics may take a while.