Fig. 1
Download original image
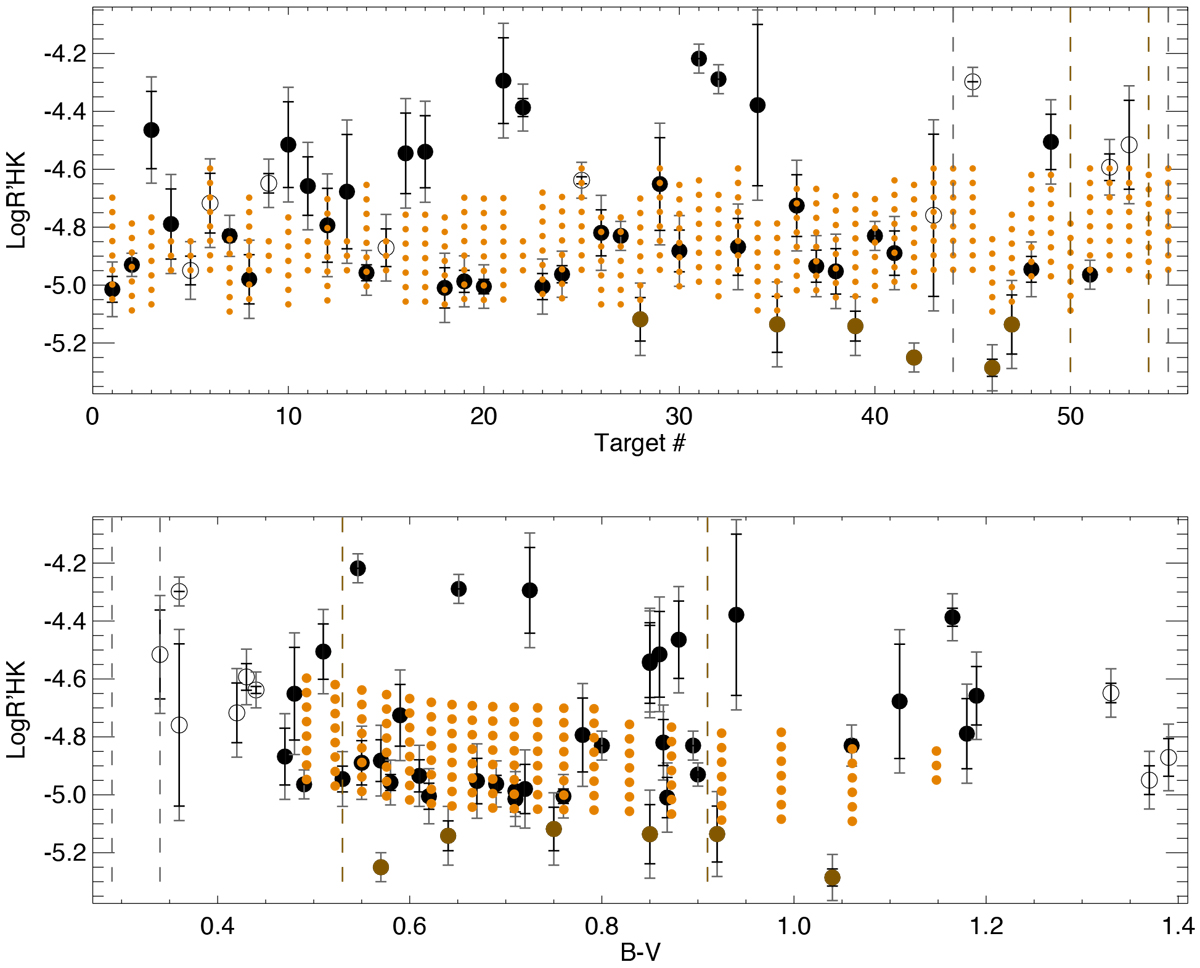
![]() versus target number (upper panel) and versus B-V (lower panel) in black (main sequence) and brown (subgiants). Open symbols correspond to stars outside the simulation range in B-V. Errorbars indicate the range covered in the literature (black), and with the addition of a
±0.05 uncertaintyto the considered range (grey). The vertical dashed lines correspond to stars with no published
versus target number (upper panel) and versus B-V (lower panel) in black (main sequence) and brown (subgiants). Open symbols correspond to stars outside the simulation range in B-V. Errorbars indicate the range covered in the literature (black), and with the addition of a
±0.05 uncertaintyto the considered range (grey). The vertical dashed lines correspond to stars with no published
![]() . The orange dots indicate the range covered by the simulations from Paper I (the actual range covers approximately
±0.05 in
. The orange dots indicate the range covered by the simulations from Paper I (the actual range covers approximately
±0.05 in ![]() given the different realisations and inclinations).
given the different realisations and inclinations).
Current usage metrics show cumulative count of Article Views (full-text article views including HTML views, PDF and ePub downloads, according to the available data) and Abstracts Views on Vision4Press platform.
Data correspond to usage on the plateform after 2015. The current usage metrics is available 48-96 hours after online publication and is updated daily on week days.
Initial download of the metrics may take a while.