Fig. 9.
Download original image
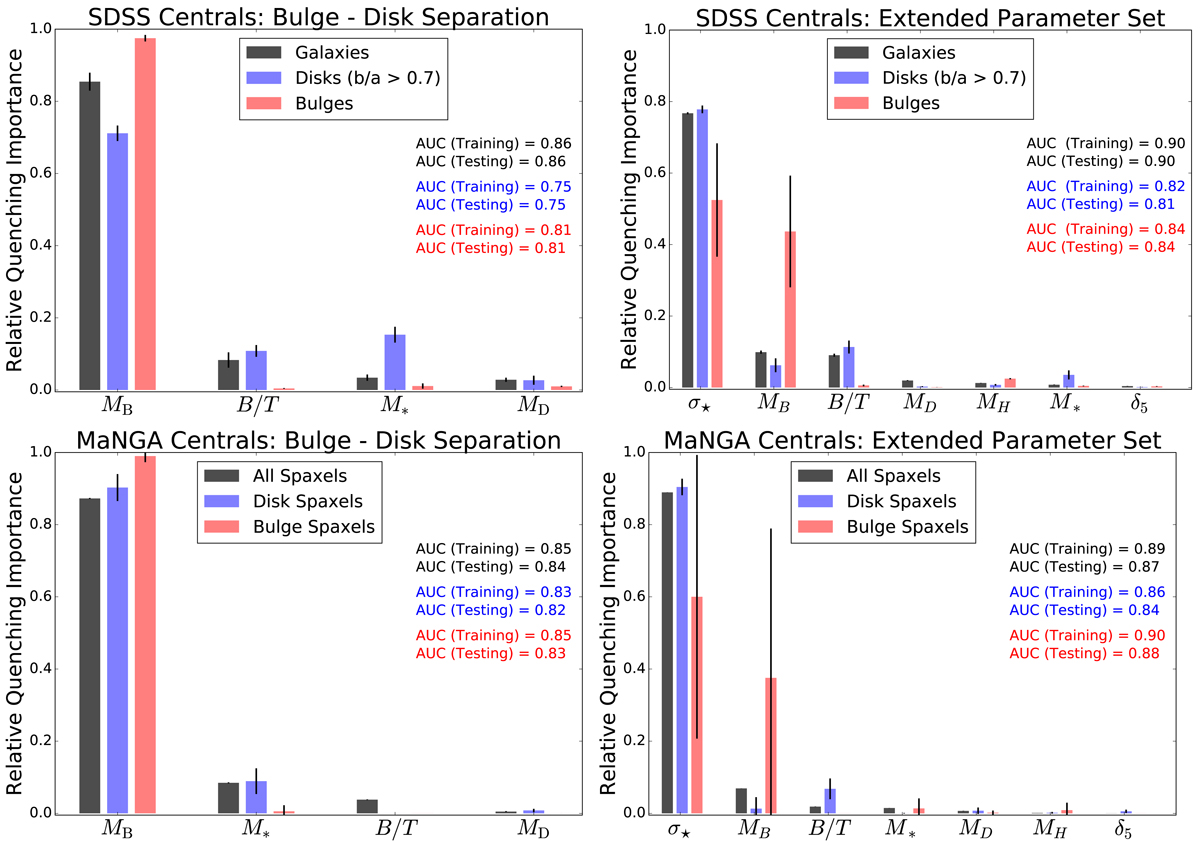
Random Forest classification analysis to predict when local Universe central galaxies (shown in black), and their component disks (shown in blue) and bulges (shown in red), are star forming or quenched. On all panels the y-axis shows the relative importance of each parameter, and the x-axis labels each parameter in turn (ordered from most to least predictive of quenching). Error bars indicate the 1σ dispersion on the relative importance from ten independent runs of the classifier. Top panels: results based on colour selection in the full SDSS data set. Bottom panels: results based on spatially resolved star formation rate surface densities in the MaNGA data set. Left-hand panels: results for the photometric bulge–disk parameters, and right-hand panels: results for the extended parameter set. For galaxies as a whole, as well as for their bulge and disk components treated separately, bulge mass is clearly identified as the most predictive of the bulge–disk parameters. However, in the extended parameter set, central velocity dispersion replaces bulge mass as the most predictive parameter of quenching for galaxies as a whole, and for disks. Yet for bulges, bulge mass and central velocity dispersion tie for first place (within their errors). For galaxies as a whole, these results are essentially identical to Fig. 4, despite using significantly different methodologies (i.e. optical colours vs. SFRs).
Current usage metrics show cumulative count of Article Views (full-text article views including HTML views, PDF and ePub downloads, according to the available data) and Abstracts Views on Vision4Press platform.
Data correspond to usage on the plateform after 2015. The current usage metrics is available 48-96 hours after online publication and is updated daily on week days.
Initial download of the metrics may take a while.