Fig. 7.
Download original image
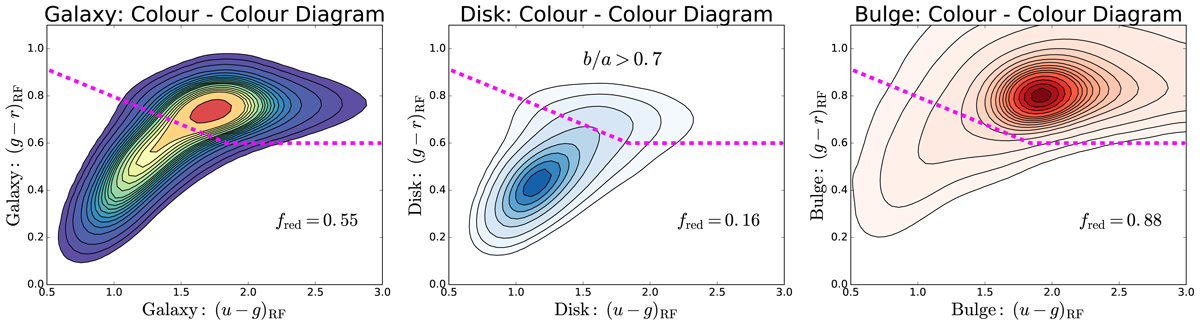
Location of galaxies (left panel), disks (middle panel) and bulges (right panel) in rest-frame (g − r)–(u − g) colour space. For the disk sample, we remove highly inclined galaxies (restricting to b/a > 0.7 systems) to mitigate the impact of dust extinction. In each panel, linearly spaced density contours are shown as light black lines with coloured shading. The adopted threshold for selecting quenched and star forming systems is shown as a dashed magenta line on each panel (which is introduced and motivated in Sect. 3.1.3). Additionally, the fraction of galaxies, bulges and disks which are identified by the cut to be quiescent are shown on the lower right of each panel.
Current usage metrics show cumulative count of Article Views (full-text article views including HTML views, PDF and ePub downloads, according to the available data) and Abstracts Views on Vision4Press platform.
Data correspond to usage on the plateform after 2015. The current usage metrics is available 48-96 hours after online publication and is updated daily on week days.
Initial download of the metrics may take a while.