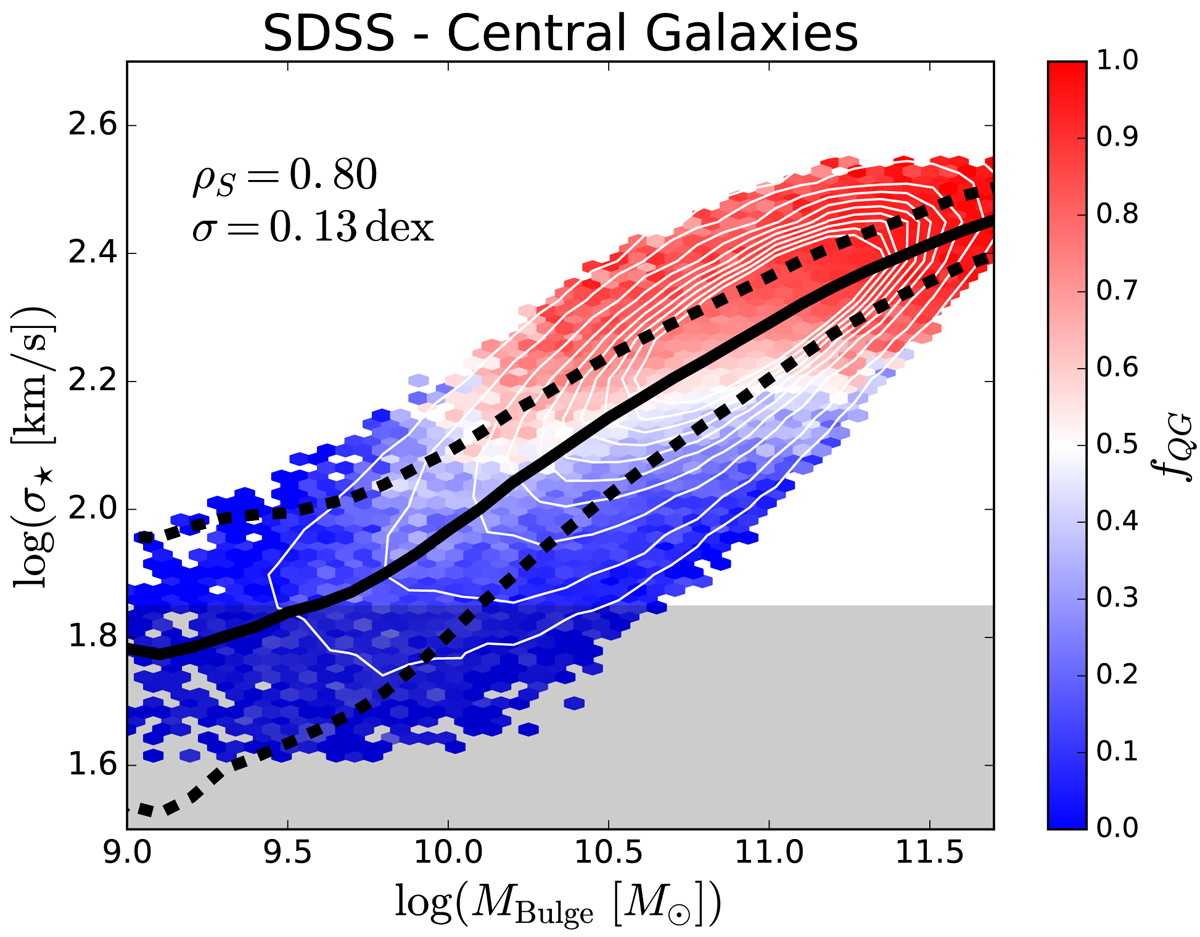
Fig. 6.
Download original image
Stellar velocity dispersion plot as a function of bulge mass for SDSS central galaxies. This plot is restricted to disk-dominated galaxies which present face-on (b/a > 0.9), in addition to all bulge-dominated galaxies. The plot is subdivided into small hexagons which display the quenched fraction within each region of the parameter space, as labelled by the colour bar. The median relation (±1σ) is shown as a solid (dashed) black line. The correlation strength between σ⋆ − MB (ρS) and the rms dispersion (σ) are both displayed on the plot. The region in which velocity dispersion is poorly constrained by the SDSS data is shaded in grey. Clearly, the optimal route to maximise quenching through this 2D plane is through increasing σ⋆ (not MB). This provides a simple visual confirmation of the primary result from the RF analysis in the right panel of Fig. 4.
Current usage metrics show cumulative count of Article Views (full-text article views including HTML views, PDF and ePub downloads, according to the available data) and Abstracts Views on Vision4Press platform.
Data correspond to usage on the plateform after 2015. The current usage metrics is available 48-96 hours after online publication and is updated daily on week days.
Initial download of the metrics may take a while.