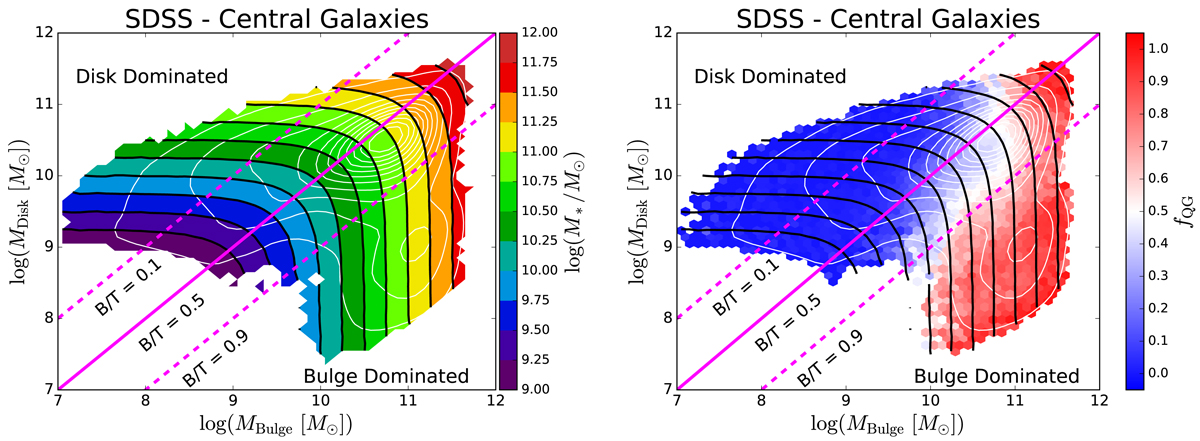
Fig. 5.

Download original image
Visual test on the primacy of bulge mass for predicting quenching. Disk mass vs. bulge mass, colour coded by total stellar mass (left panel) and the fraction of quenched galaxies (right panel). In both panels iso-mass and iso-morphology (i.e. B/T) lines are drawn to guide the eye, shown in black and magenta (respectively). Quenched central galaxies typically have high bulge masses. Note also that at a fixed stellar mass galaxies may be either star forming or quenched dependent upon B/T; and yet at fixed B/T galaxies may be either star forming or quenched dependent upon M*. Moreover, there is little-to-no visual dependence of quenching on disk mass explicitly. Hence, quenching proceeds most closely with increasing bulge mass. This provides a simple visual confirmation of the primary result from the RF analysis in the left panel of Fig. 4.
Current usage metrics show cumulative count of Article Views (full-text article views including HTML views, PDF and ePub downloads, according to the available data) and Abstracts Views on Vision4Press platform.
Data correspond to usage on the plateform after 2015. The current usage metrics is available 48-96 hours after online publication and is updated daily on week days.
Initial download of the metrics may take a while.


