Fig. B.1.
Download original image
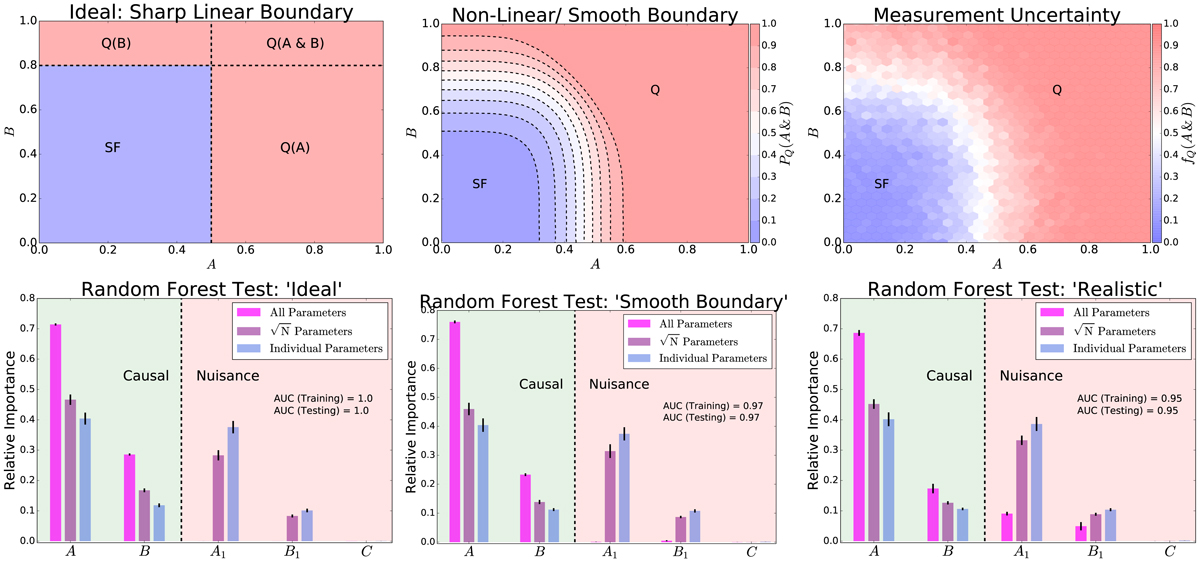
Tests on the Random Forest approach. Top panels: Simple 2-dimensional classification problems, with increasing complexity from left-to-right. Top-left panel: ‘Quenching’ occurs as a result of the following criteria: (A > 0.5) ∪ (B > 0.8). Top-middle panel: ‘Quenching’ occurs probabilistically as a result of a smooth non-linear function of the A & B parameters (see eqs. B.10 & B.11). Top-right panel: Same as the previous panel but with added Gaussian random noise. Bottom panels: Results from Random Forest classification analyses to ascertain the relative importance of the following parameters: A (the most important causal parameter), B (the secondary causal parameter), A1 (an a causal ‘nuisance’ parameter, highly correlated with A), B1 (an a causal ‘nuisance’ parameter, highly correlated with B), and C (an a causal parameter uncorrelated with either A or B). The Random Forest classification is run in three modes: i) considering all parameters at each fork in the decision tree; ii) considering ![]() parameters at each fork (randomly selected); iii) considering only one parameter at each fork (randomly selected). The run utilising all variables at every decision fork correctly assigns the highest importance to the causal parameters at all levels of complexity.
parameters at each fork (randomly selected); iii) considering only one parameter at each fork (randomly selected). The run utilising all variables at every decision fork correctly assigns the highest importance to the causal parameters at all levels of complexity.
Current usage metrics show cumulative count of Article Views (full-text article views including HTML views, PDF and ePub downloads, according to the available data) and Abstracts Views on Vision4Press platform.
Data correspond to usage on the plateform after 2015. The current usage metrics is available 48-96 hours after online publication and is updated daily on week days.
Initial download of the metrics may take a while.