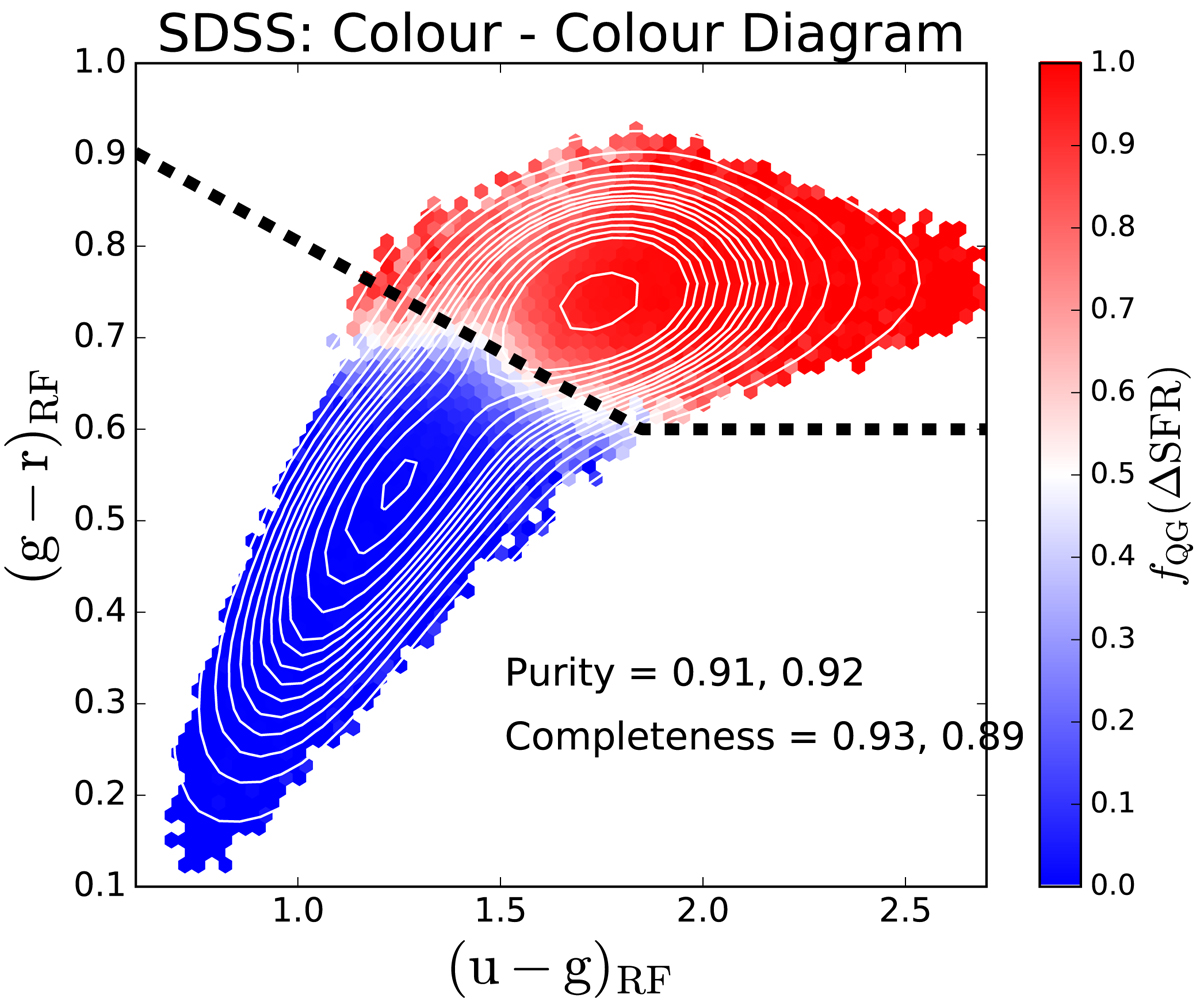
Fig. 2.
Download original image
Location of SDSS galaxies in rest-frame (g − r)–(u − g) colour space. Only galaxies with a solid star forming vs. quenched classification are included in this figure. Density contours are shown as light white lines, indicating that bimodality in ΔSFR is accompanied by bimodality in colour. Additionally, the ((g − r)–(u − g)) plane is subdivided into small hexagonal regions, each colour coded by the fraction of quenched galaxies (as indicated by the colour bar). The optimal linear decision boundary in colour space to classify star forming and quenched systems is shown by a dashed black line. Overlaid on the figure is the purity and completeness obtained by this cut (shown respectively for red, blue objects).
Current usage metrics show cumulative count of Article Views (full-text article views including HTML views, PDF and ePub downloads, according to the available data) and Abstracts Views on Vision4Press platform.
Data correspond to usage on the plateform after 2015. The current usage metrics is available 48-96 hours after online publication and is updated daily on week days.
Initial download of the metrics may take a while.