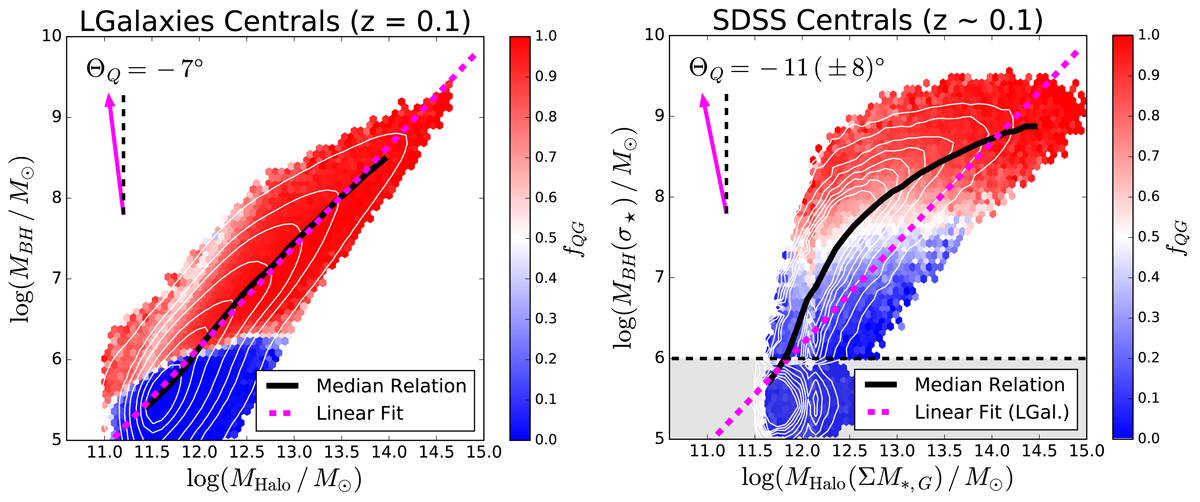
Fig. 19.
Download original image
Black hole mass–halo mass relationship in LGalaxies (left panel) and in the SDSS (right panel) for central galaxies at z ∼ 0.1. On both panels, the MBH − MHalo plane is subdivided into small hexagonal regions, each colour coded by the quenched fraction of galaxies within that region of parameter space (as labelled by the colour bar). The optimal direction to travel through the plane in order to maximise quenching is indicated by a magenta arrow, with an orientation quantified by the quenching angle (ΘQ). For the observational data, uncertainties on the quenching angle are estimated from bootstrapped random sampling within the measurement uncertainties. On both panels, density contours are shown in white (which are 1/Vmax volume weighted for the SDSS), and the median relations are shown by solid black lines. On the right panel, the region in which SDSS velocity dispersions become unreliable (used here to estimate MBH) is shaded out. On both panels we display a linear least squares fit to the LGalaxies MBH − MHalo relation, utilised in the right panel to aid in comparison. Clearly, quenching proceeds primarily with black hole mass in both the LGalaxies model and in the SDSS observations, with a subtle secondary anti-correlation with halo mass.
Current usage metrics show cumulative count of Article Views (full-text article views including HTML views, PDF and ePub downloads, according to the available data) and Abstracts Views on Vision4Press platform.
Data correspond to usage on the plateform after 2015. The current usage metrics is available 48-96 hours after online publication and is updated daily on week days.
Initial download of the metrics may take a while.