Fig. 16.
Download original image
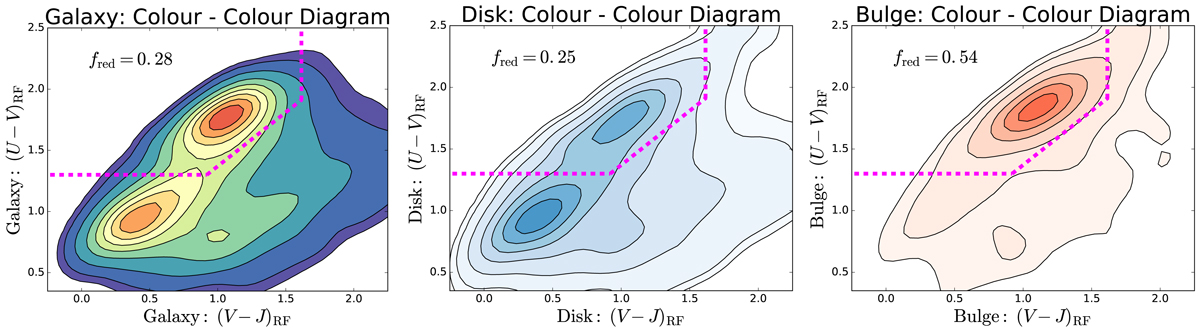
Location of CANDELS galaxies (left panel), disks (middle panel), and bulges (right panel) in rest-frame (U − V)–(V − J) colour space. The threshold for quenching from Williams et al. (2009) at z = 1.0 is shown as a dashed magenta line on each panel. Additionally, the fraction of red galaxies, disks and bulges is overlaid on the upper left of each panel.
Current usage metrics show cumulative count of Article Views (full-text article views including HTML views, PDF and ePub downloads, according to the available data) and Abstracts Views on Vision4Press platform.
Data correspond to usage on the plateform after 2015. The current usage metrics is available 48-96 hours after online publication and is updated daily on week days.
Initial download of the metrics may take a while.