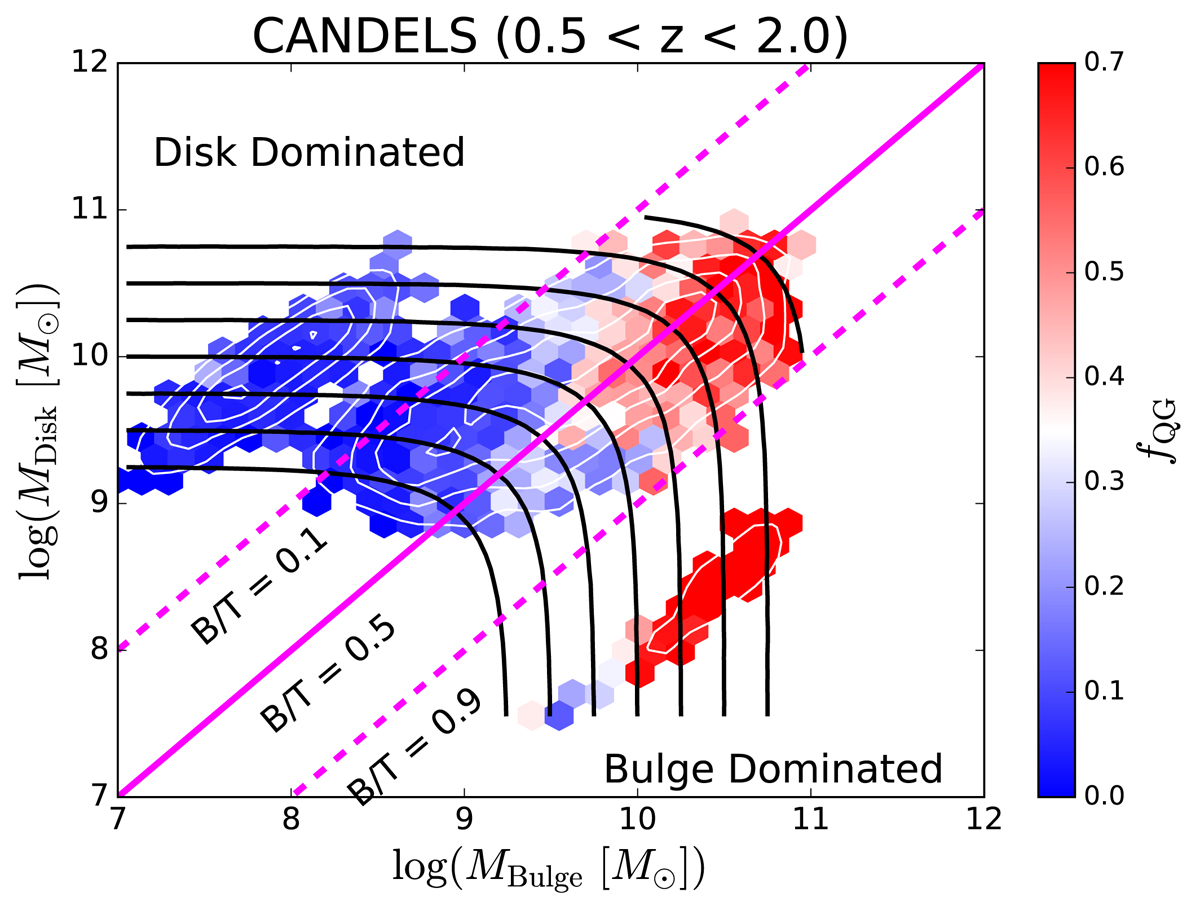
Fig. 15.
Download original image
Distribution of CANDELS galaxies in the MD − MB plane for the full redshift range (0.5 < z < 2.0). The location of galaxies is indicated by density contours (shown in white). Note that the tri-modality of the contour distribution is a result of us relocating pure spheroids and pure disks to a nominal position of B/T = 0.99 and 0.01 respectively (for display purposes). Iso-mass and iso-morphology contours are shown on both panels as black and magenta lines, respectively. The MD − MB plane is colour coded by quenched fraction (as indicated by the colour bar labels). Clearly, quenching progresses primarily with bulge mass in these data, which confirms the primary RF result shown in Fig. 14. It is also instructive to compare this figure with Fig. 5 for the SDSS.
Current usage metrics show cumulative count of Article Views (full-text article views including HTML views, PDF and ePub downloads, according to the available data) and Abstracts Views on Vision4Press platform.
Data correspond to usage on the plateform after 2015. The current usage metrics is available 48-96 hours after online publication and is updated daily on week days.
Initial download of the metrics may take a while.