Fig. 14.
Download original image
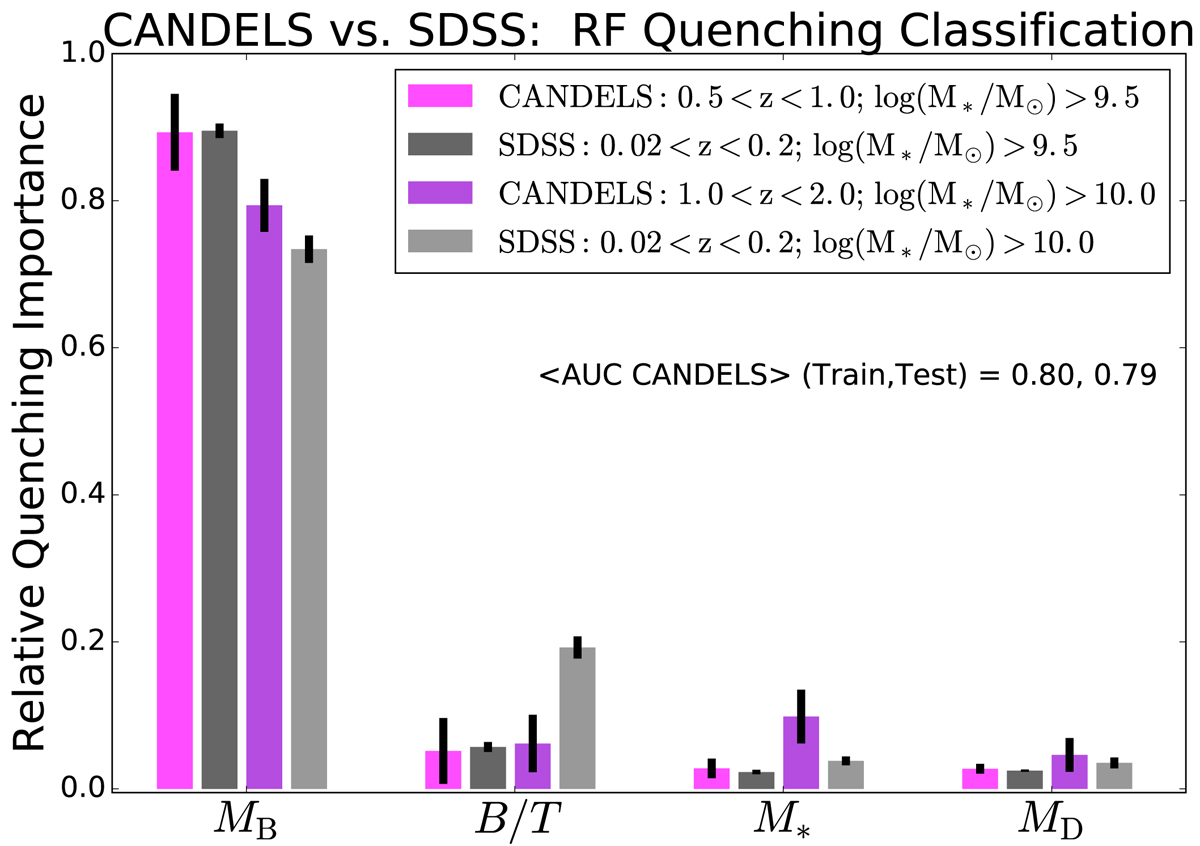
Random Forest quenching classification analysis showing results for the bulge–disk parameters in CANDELS (shown in shades of purple) compared to the SDSS (shown in shades of grey). The structure of this plot is similar to Fig. 5 (left panel). The two surveys are compared at various mass cuts (as noted in the legend), ensuring that differences in their stellar mass distributions are minimised. In all datasets, the full galaxy sample is used here (i.e. no restriction to centrals is made) and a colour based definition of quenching is utilised, ensuring a high level of consistency between the samples. Bulge mass is found to be the clear best parameter for predicting quenching in both the high and intermediate redshift CANDELS data, and in the low redshift SDSS data.
Current usage metrics show cumulative count of Article Views (full-text article views including HTML views, PDF and ePub downloads, according to the available data) and Abstracts Views on Vision4Press platform.
Data correspond to usage on the plateform after 2015. The current usage metrics is available 48-96 hours after online publication and is updated daily on week days.
Initial download of the metrics may take a while.