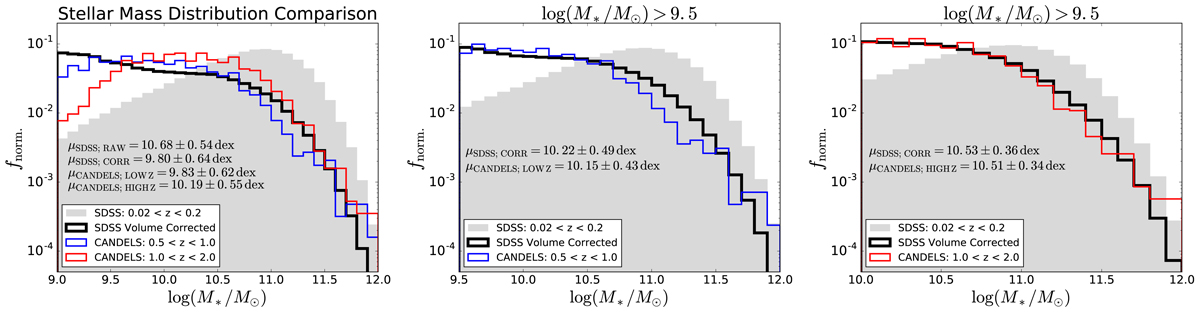
Fig. 13.
Download original image
Distribution of stellar mass in the SDSS and CANDELS datasets. Left panel: normalised stellar mass distribution for the full mass range in the SDSS compared to the intermediate (0.5 < z < 1.0) and high (1.0 < z < 2.0) redshift ranges in CANDELS. The SDSS mass distribution is shown in a raw (shaded histogram) and volume corrected (solid black line) form. Note that there is much better agreement between the volume corrected SDSS mass distribution and the CANDELS data, due to the much greater depth of CANDELS. Nonetheless, there is systematic incompletion at low masses in CANDELS. Middle panel: comparison of intermediate redshift CANDELS data to the SDSS at a stellar mass limit of log(M*/M⊙) > 9.5. Right panel: comparison of high redshift CANDELS data to the SDSS at a stellar mass limit of log(M*/M⊙) > 10. Middle and left panels: there is reasonable qualitative agreement between the mass distributions, and the mean and standard deviation of each sample agree comfortably within 0.1 dex in both cases. We use the mass restricted samples for our quantitative comparison between quenching in the two surveys, to avoid issues from differing stellar mass distributions.
Current usage metrics show cumulative count of Article Views (full-text article views including HTML views, PDF and ePub downloads, according to the available data) and Abstracts Views on Vision4Press platform.
Data correspond to usage on the plateform after 2015. The current usage metrics is available 48-96 hours after online publication and is updated daily on week days.
Initial download of the metrics may take a while.