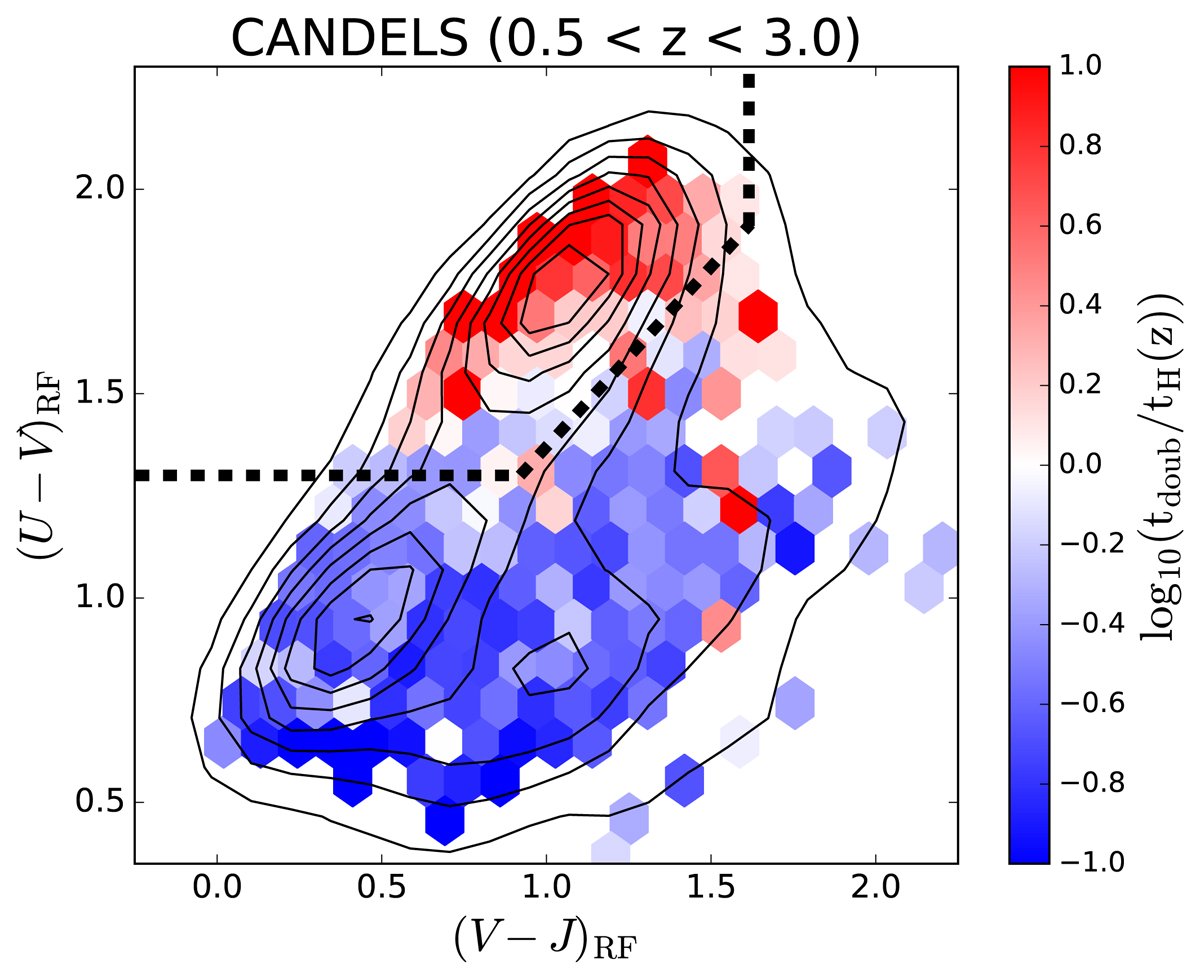
Fig. 12.
Download original image
UVJ colour–colour diagram for CANDELS galaxies. The location of galaxies in colour space is shown by black density contours. Each hexagonal region of the plane is colour coded by the mean doubling time (1/sSFR) expressed in units of the Hubble time (tH(z)). The threshold for quenching from Williams et al. (2009) at z = 1 (the median redshift of CANDELS galaxies in our sample) is shown as a dashed magenta line. Note that there is good qualitative agreement between colour and SED sSFR methods for identifying quenched galaxies.
Current usage metrics show cumulative count of Article Views (full-text article views including HTML views, PDF and ePub downloads, according to the available data) and Abstracts Views on Vision4Press platform.
Data correspond to usage on the plateform after 2015. The current usage metrics is available 48-96 hours after online publication and is updated daily on week days.
Initial download of the metrics may take a while.