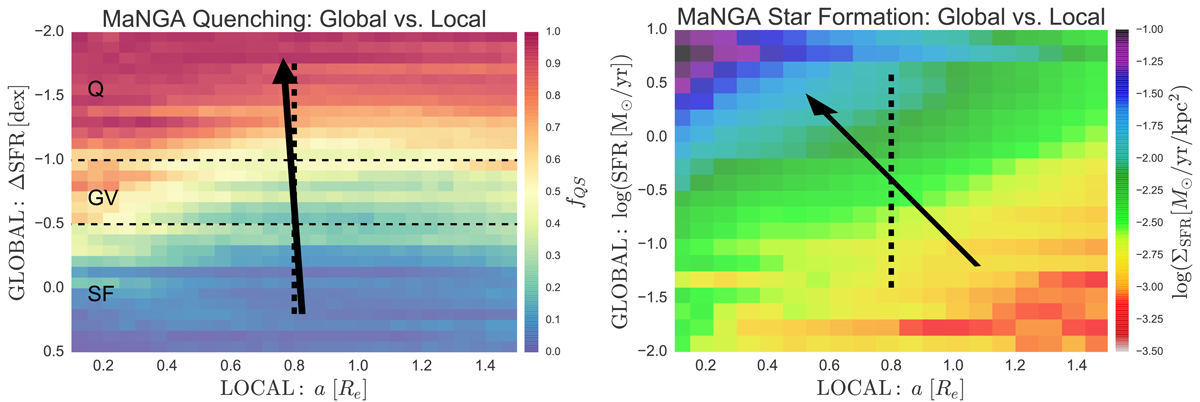
Fig. 11.
Download original image
Visual test of whether quenching and star formation are regulated by global or local physics. Left panel: global vs. local quenching colour map. The fraction of quenched spaxels in each rectangular bin is displayed by colour (labelled by the colour bar), shown as a function of the global galaxy star forming state (quantified by ΔSFR) and the position of spaxels within the galaxy (quantified by the deprojected elliptical radius, a). The location of the global ‘green valley’ is indicated by dashed black lines. Right panel: global vs. local star formation rate colour map. The mean star formation rate surface density for star forming systems in each rectangular bin is displayed by colour (labelled by the colour bar), shown as a function of global galaxy SFR and deprojected elliptical radius (a). There is evidently little radial dependence on quenching, except for a weak trend around the green valley. Alternatively, for star formation, there is a highly pronounced radial dependence evident at all values of global SFR. To quantify the relative dependence on global and local processes, on each panel we show an arrow which points in the direction of maximising quenched fraction (ΘQ = −3 ± 1°, left panel) and star formation rate (ΘSF = −37 ± 5°, right panel). Note that quenching proceeds almost vertically in the plane, indicating global dependence; whereas star formation proceeds diagonally, indicating significant local and global dependence.
Current usage metrics show cumulative count of Article Views (full-text article views including HTML views, PDF and ePub downloads, according to the available data) and Abstracts Views on Vision4Press platform.
Data correspond to usage on the plateform after 2015. The current usage metrics is available 48-96 hours after online publication and is updated daily on week days.
Initial download of the metrics may take a while.