Fig. 10.
Download original image
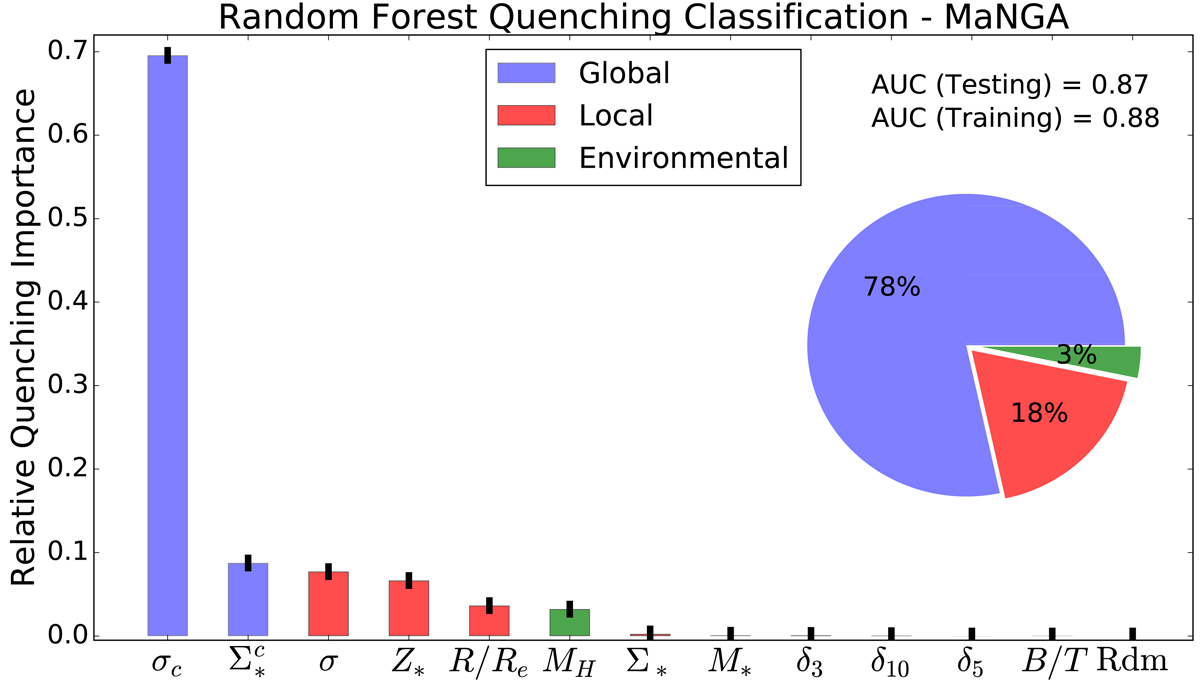
Reproduction of Fig. 9 (top panel) from Bluck et al. (2020a) utilising here the All Parameter RF classification mode (as opposed to the ![]() Parameter [default] model used previously). This figure shows the relative importance of global, local and environmental parameters for predicting quenching on spatially resolved scales in central galaxies observed in MaNGA. The y-axis displays the relative quenching importance of each variable in turn, and the x-axis labels each variable (shown in descending order of importance). From left-to-right, the parameters displayed are: central velocity dispersion (σc); central stellar mass surface density (
Parameter [default] model used previously). This figure shows the relative importance of global, local and environmental parameters for predicting quenching on spatially resolved scales in central galaxies observed in MaNGA. The y-axis displays the relative quenching importance of each variable in turn, and the x-axis labels each variable (shown in descending order of importance). From left-to-right, the parameters displayed are: central velocity dispersion (σc); central stellar mass surface density (![]() ); velocity dispersion within each spaxel (σ), metallicity within each spaxel (Z*); position of each spaxel within the galaxy (R/Re); halo mass (MH); stellar mass surface density within each spaxel (Σ*); total stellar mass of the galaxy (M*); local density evaluated at the 3rd, 10th and 5th nearest neighbours (δ3, δ10, δ5); bulge-to-total stellar mass ratio of the galaxy (B/T); and a random number (Rdm). Parameter bars are colour coded by whether the parameter is global (one parameter per galaxy, pertaining to the galaxy as a whole); local (one parameter per spaxel); or environmental (one parameter per galaxy, pertaining to the environment in which the galaxy resides). Uncertainties on the relative importances are given as the variance across 10 independent training and testing runs. It is clear that central velocity dispersion is by far the most predictive parameter of quenching on ∼kpc scales. Additionally, global parameters collectively are much more effective at predicting quenching on ∼kpc scales than local or environmental parameters (see the pie chart, inset).
); velocity dispersion within each spaxel (σ), metallicity within each spaxel (Z*); position of each spaxel within the galaxy (R/Re); halo mass (MH); stellar mass surface density within each spaxel (Σ*); total stellar mass of the galaxy (M*); local density evaluated at the 3rd, 10th and 5th nearest neighbours (δ3, δ10, δ5); bulge-to-total stellar mass ratio of the galaxy (B/T); and a random number (Rdm). Parameter bars are colour coded by whether the parameter is global (one parameter per galaxy, pertaining to the galaxy as a whole); local (one parameter per spaxel); or environmental (one parameter per galaxy, pertaining to the environment in which the galaxy resides). Uncertainties on the relative importances are given as the variance across 10 independent training and testing runs. It is clear that central velocity dispersion is by far the most predictive parameter of quenching on ∼kpc scales. Additionally, global parameters collectively are much more effective at predicting quenching on ∼kpc scales than local or environmental parameters (see the pie chart, inset).
Current usage metrics show cumulative count of Article Views (full-text article views including HTML views, PDF and ePub downloads, according to the available data) and Abstracts Views on Vision4Press platform.
Data correspond to usage on the plateform after 2015. The current usage metrics is available 48-96 hours after online publication and is updated daily on week days.
Initial download of the metrics may take a while.