Fig. 1.
Download original image
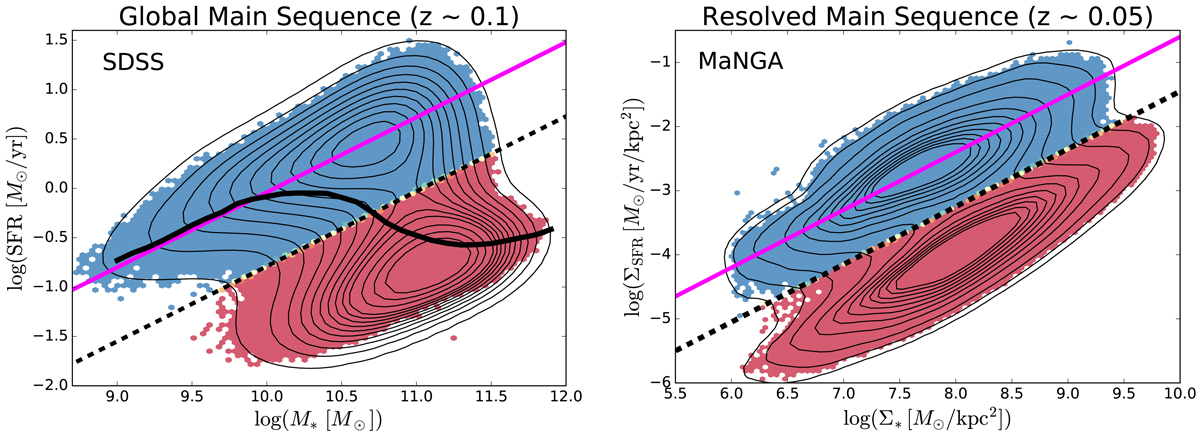
Illustration of methods to classify star forming and quenched objects in the local Universe. Left panel: global star forming main sequence (SFR–M* relation) for SDSS galaxies (at z ∼ 0.1). Right panel: spatially resolved star forming main sequence (ΣSFR − Σ* relation) for MaNGA spaxels (at z ∼ 0.05). In each panel, density contours are shown as light black lines, revealing clear bimodality in both the global and resolved realisations of the star forming main sequence. However, it must be stressed that the quiescent population in both panels are only upper limits on their true SFRs and hence in reality form a sequence to arbitrarily low values. Our definition of star forming and quenched classes for both data sets are indicated by the colour shading (blue for star forming; red for quenched). Additionally, the quenching threshold is highlighted by a dashed black line and the best fit relation for the star forming subset is indicated by a solid magenta line, shown on each panel. For the global main sequence, the median SFR–M* relation is displayed by a thick black line, which shows a transition from star forming to quenched at M* ∼ 1010.5 M⊙.
Current usage metrics show cumulative count of Article Views (full-text article views including HTML views, PDF and ePub downloads, according to the available data) and Abstracts Views on Vision4Press platform.
Data correspond to usage on the plateform after 2015. The current usage metrics is available 48-96 hours after online publication and is updated daily on week days.
Initial download of the metrics may take a while.