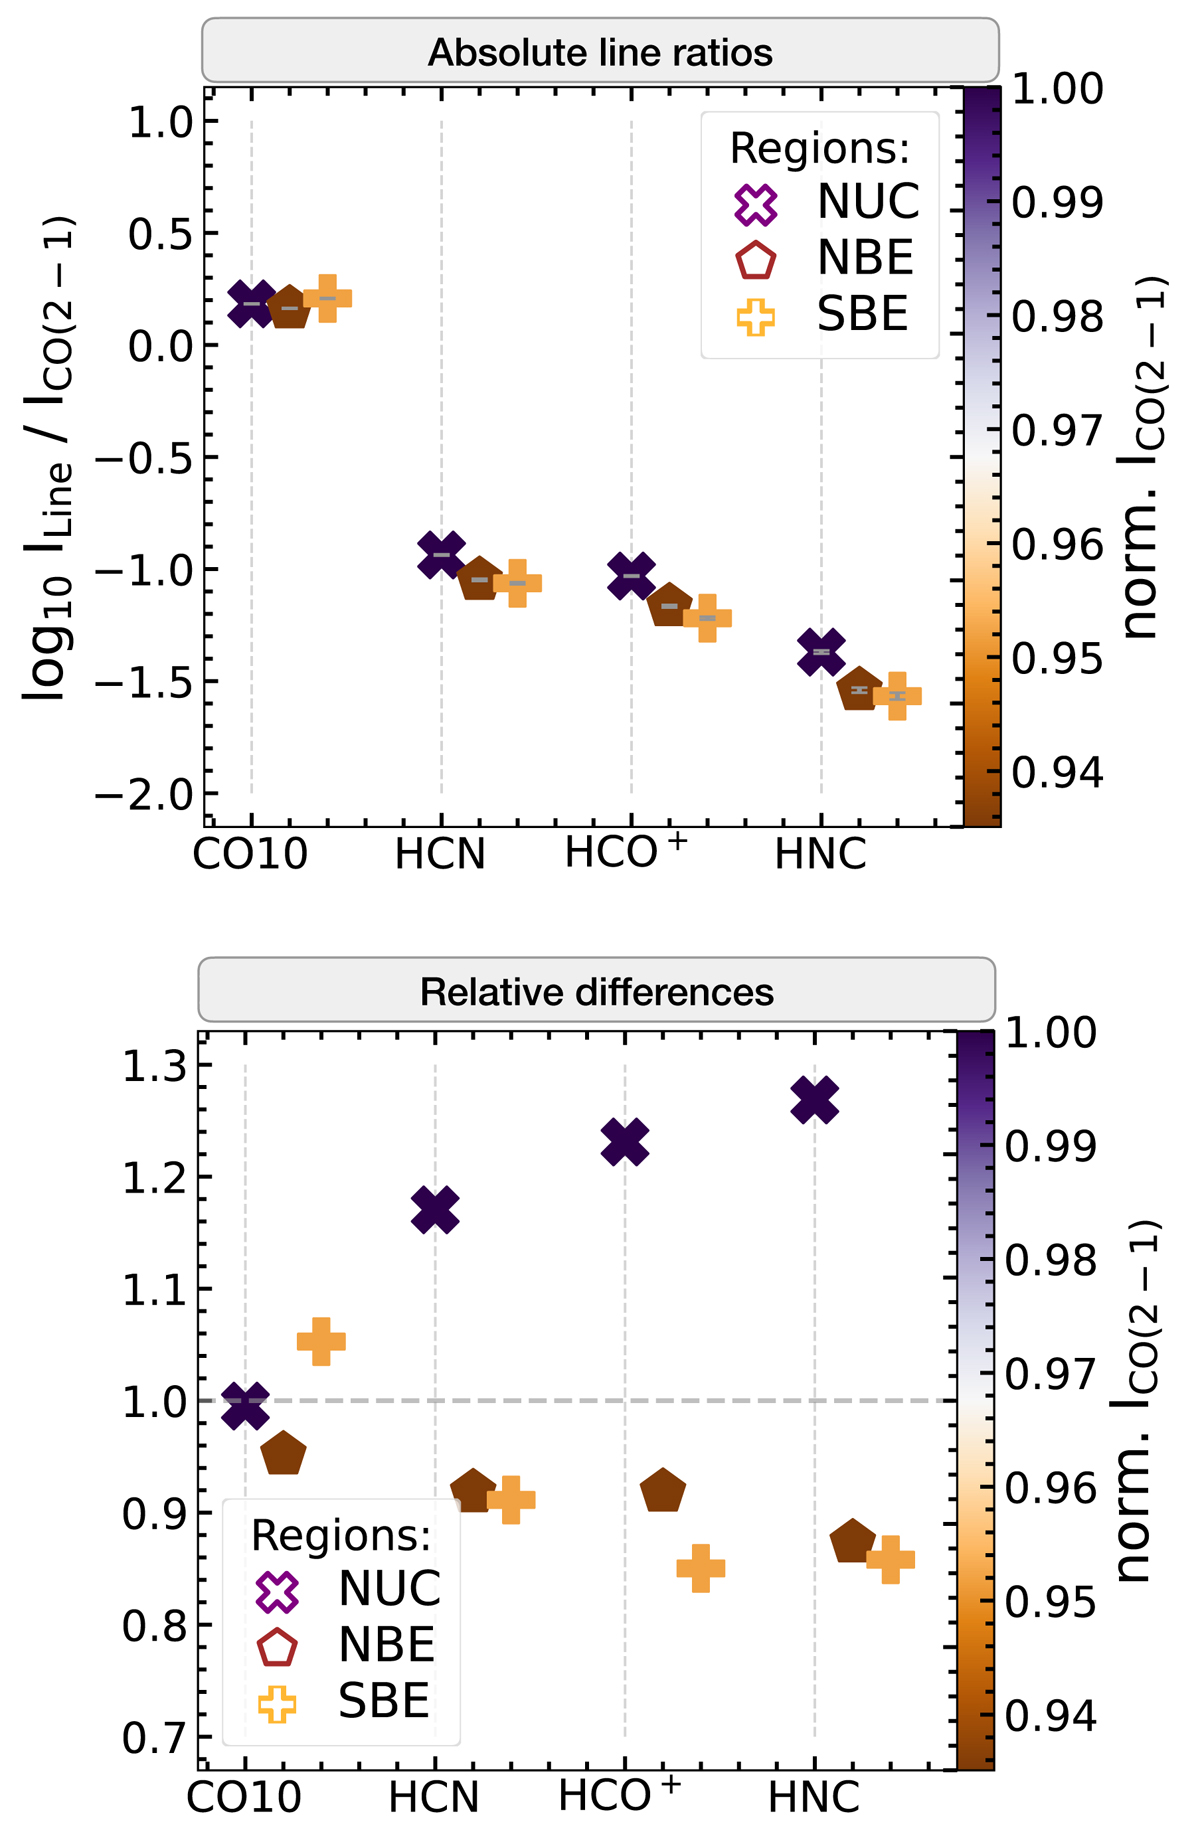
Fig. 9.
Download original image
Line ratios for the nuclear region and inner-bar ends. Top: scatter plot showing the mean line ratios of the 7 hexagonal points for each molecule on the y-axis with respect to CO(2−1). For visualisation purpose we spaced the markers along the x-axis. The different shapes of the markers present the defined regions. The colourbar shows the normalised CO(2−1) integrated intensity to the mean CO(2−1) value. We plot the propagated errors in grey and find that they are very small. For the ratios we applied a signal-to-noise cut (see Sect. 5.1). Bottom: the relative differences of the line ratios with respect to the mean of the line ratios among the different regions (linear-scale).
Current usage metrics show cumulative count of Article Views (full-text article views including HTML views, PDF and ePub downloads, according to the available data) and Abstracts Views on Vision4Press platform.
Data correspond to usage on the plateform after 2015. The current usage metrics is available 48-96 hours after online publication and is updated daily on week days.
Initial download of the metrics may take a while.