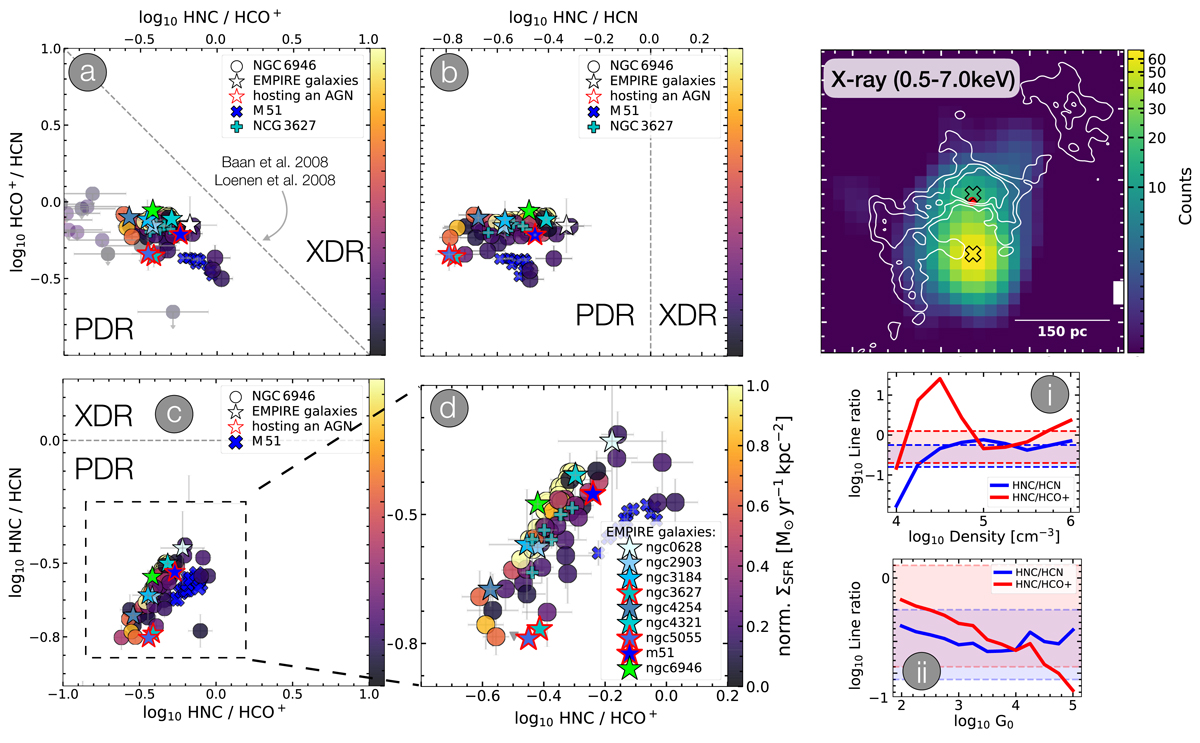
Fig. 8.
Download original image
Diagnostic plots using integrated line ratios of HCN, HNC and HCO+ versus each other. Left panels: (a): integrated HCO+/HCN versus HNC/HCO+ ratios. (b): integrated HCO+/HCN versus HNC/HCN ratios. (c): integrated HNC/HCN versus HNC/HCO+ ratios. The grey dashed lines marks the boarder between XDR and PDR (Baan et al. 2008; Loenen et al. 2008). Circles indicate reliable values (S/N > 5) and upper limits for the central 20″ ≈ 745 pc towards NGC 6946. Stars show the EMPIRE galaxies and stars with red contours present galaxy centres hosting an AGN (Goulding & Alexander 2009). For two of them we find ancillary data: the cross shaped markers show the ∼4″ (≈166 pc) M 51 observations (Querejeta et al. 2016) and the ∼2″ (≈100 pc) NGC 3627 observations (Bešlić et al. 2021). (d): the enclosed integrated HNC/HCN versus HNC/HCO+ with the kpc-sized centres of the EMPIRE survey (see Jiménez-Donaire et al. 2019 for details). NGC 6946 and the EMPIRE galaxies are in the PDR regime in all panels. Interestingly, EMPIRE galaxies harbouring an AGN do not show an enhancement of HCN as suggested in many studies (see text for a discussion). We run (Meijerink & Spaans 2005) PDR models for the observed ranges of line ratios (blue and red shaded areas) by (i) fixing the radiation field and (ii) fixing the density. The red and blue lines show the model output (more in text). The colours in (a–d) indicate ΣSFR. We have normalised them to the mean ΣSFR value and find no trend with the integrated line ratios. Upper right panel: X-ray 0.5 − 7.0 keV in counts for NGC 6946 with integrated CO(2−1) contours on top. The black crosses mark the positions of the detected X-ray sources by Holt et al. (2003) which are not strong enough to trigger a XDR.
Current usage metrics show cumulative count of Article Views (full-text article views including HTML views, PDF and ePub downloads, according to the available data) and Abstracts Views on Vision4Press platform.
Data correspond to usage on the plateform after 2015. The current usage metrics is available 48-96 hours after online publication and is updated daily on week days.
Initial download of the metrics may take a while.