Fig. 7.
Download original image
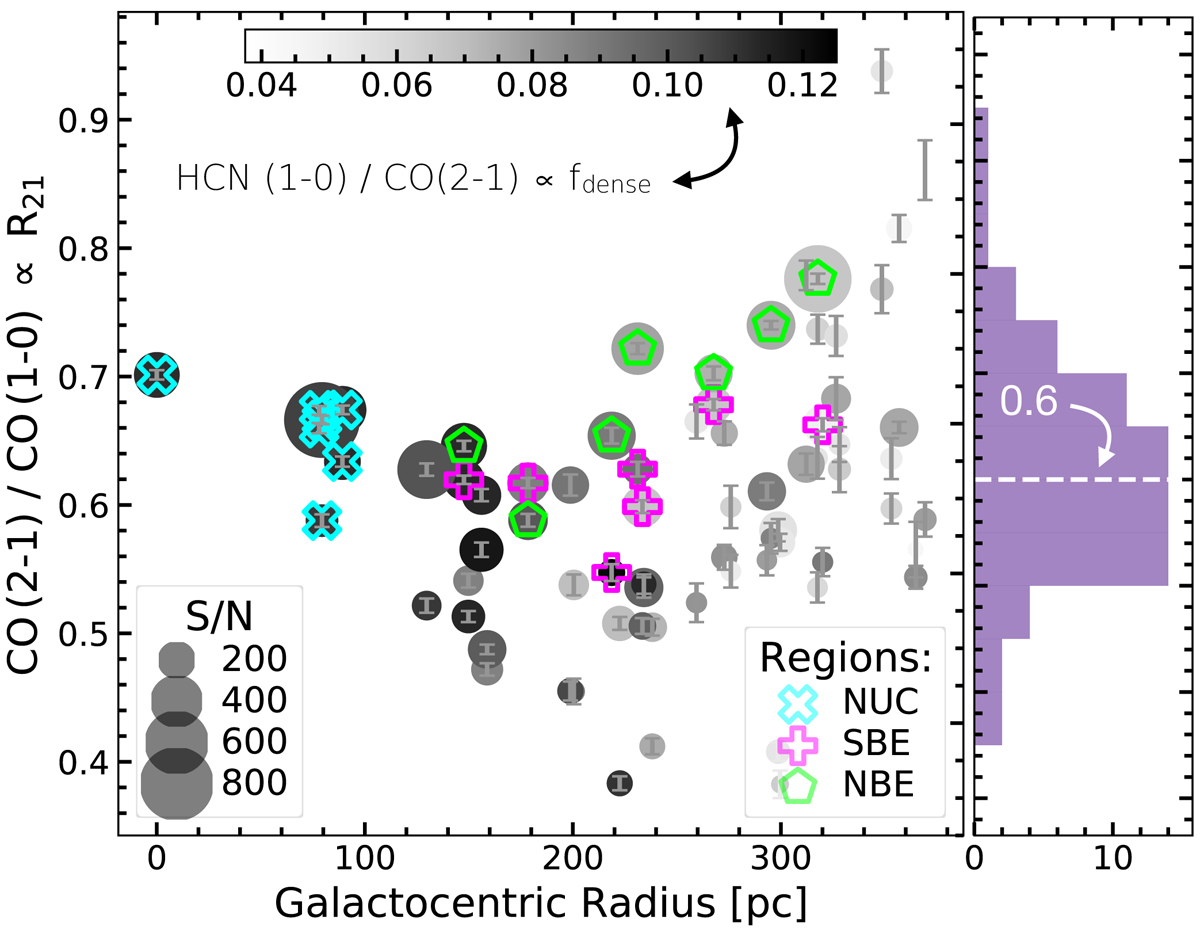
R21 against galactocentric radius. The circular shaped markers represent all of the R21 values for the central 20″ ≈ 745 pc coloured by their fdense. The different sizes show their varying signal-to-noise ratio in CO(2−1). Additionally, we overplot the contours of the three different regions: The cyan colour refers to the nuclear region (NUC), the green to the northern bar end (NBE) and the magenta to the southern bar end (SBE). Along the galactocentric radius, we find in the centre higher R21 values, an initial steady decrease followed by a gradual increase. R21 towards NBE is higher than expected (more in Sect. 6.1).
Current usage metrics show cumulative count of Article Views (full-text article views including HTML views, PDF and ePub downloads, according to the available data) and Abstracts Views on Vision4Press platform.
Data correspond to usage on the plateform after 2015. The current usage metrics is available 48-96 hours after online publication and is updated daily on week days.
Initial download of the metrics may take a while.