Fig. 4.
Download original image
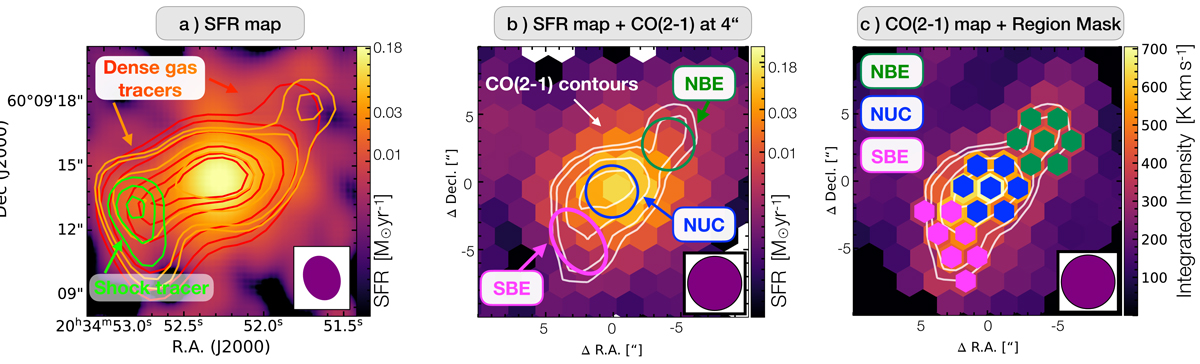
Star formation rate map and region mask. Panel a: SFR map with red, orange and green contours of HCN(1−0), HNC(1−0) and CH3OH(3 − 2) integrated intensities (we used the thermal part of the 33 GHz continuum emission at ![]() resolution; see Sect. 2.3.2 for SFR calibration). Panel b: SFR map at 4″ ≈ 150 pc resolution on hexagonal grid with white contours of CO(2−1) integrated intensities. Overploted are the identified regions – nuclear region, northern and southern inner bar end. Panel c: the region mask showing the chosen hexagonal points in colours of green for the northern inner bar end, blue for the nuclear region and pink for the southern inner bar end. To each of the regions we associate – equivalent to our beam size of 4″ – seven individual lines of sight (hexagonal points). In the background we show the integrated intensity map of CO(2−1) at 4″ resolution. We detect in the southern inner bar end higher SFR in combination with shock tracers (e.g. CH3OH (3k−2k)) and higher concentration of denser gas (e.g. HCN(1−0)) than in the northern inner bar end.
resolution; see Sect. 2.3.2 for SFR calibration). Panel b: SFR map at 4″ ≈ 150 pc resolution on hexagonal grid with white contours of CO(2−1) integrated intensities. Overploted are the identified regions – nuclear region, northern and southern inner bar end. Panel c: the region mask showing the chosen hexagonal points in colours of green for the northern inner bar end, blue for the nuclear region and pink for the southern inner bar end. To each of the regions we associate – equivalent to our beam size of 4″ – seven individual lines of sight (hexagonal points). In the background we show the integrated intensity map of CO(2−1) at 4″ resolution. We detect in the southern inner bar end higher SFR in combination with shock tracers (e.g. CH3OH (3k−2k)) and higher concentration of denser gas (e.g. HCN(1−0)) than in the northern inner bar end.
Current usage metrics show cumulative count of Article Views (full-text article views including HTML views, PDF and ePub downloads, according to the available data) and Abstracts Views on Vision4Press platform.
Data correspond to usage on the plateform after 2015. The current usage metrics is available 48-96 hours after online publication and is updated daily on week days.
Initial download of the metrics may take a while.