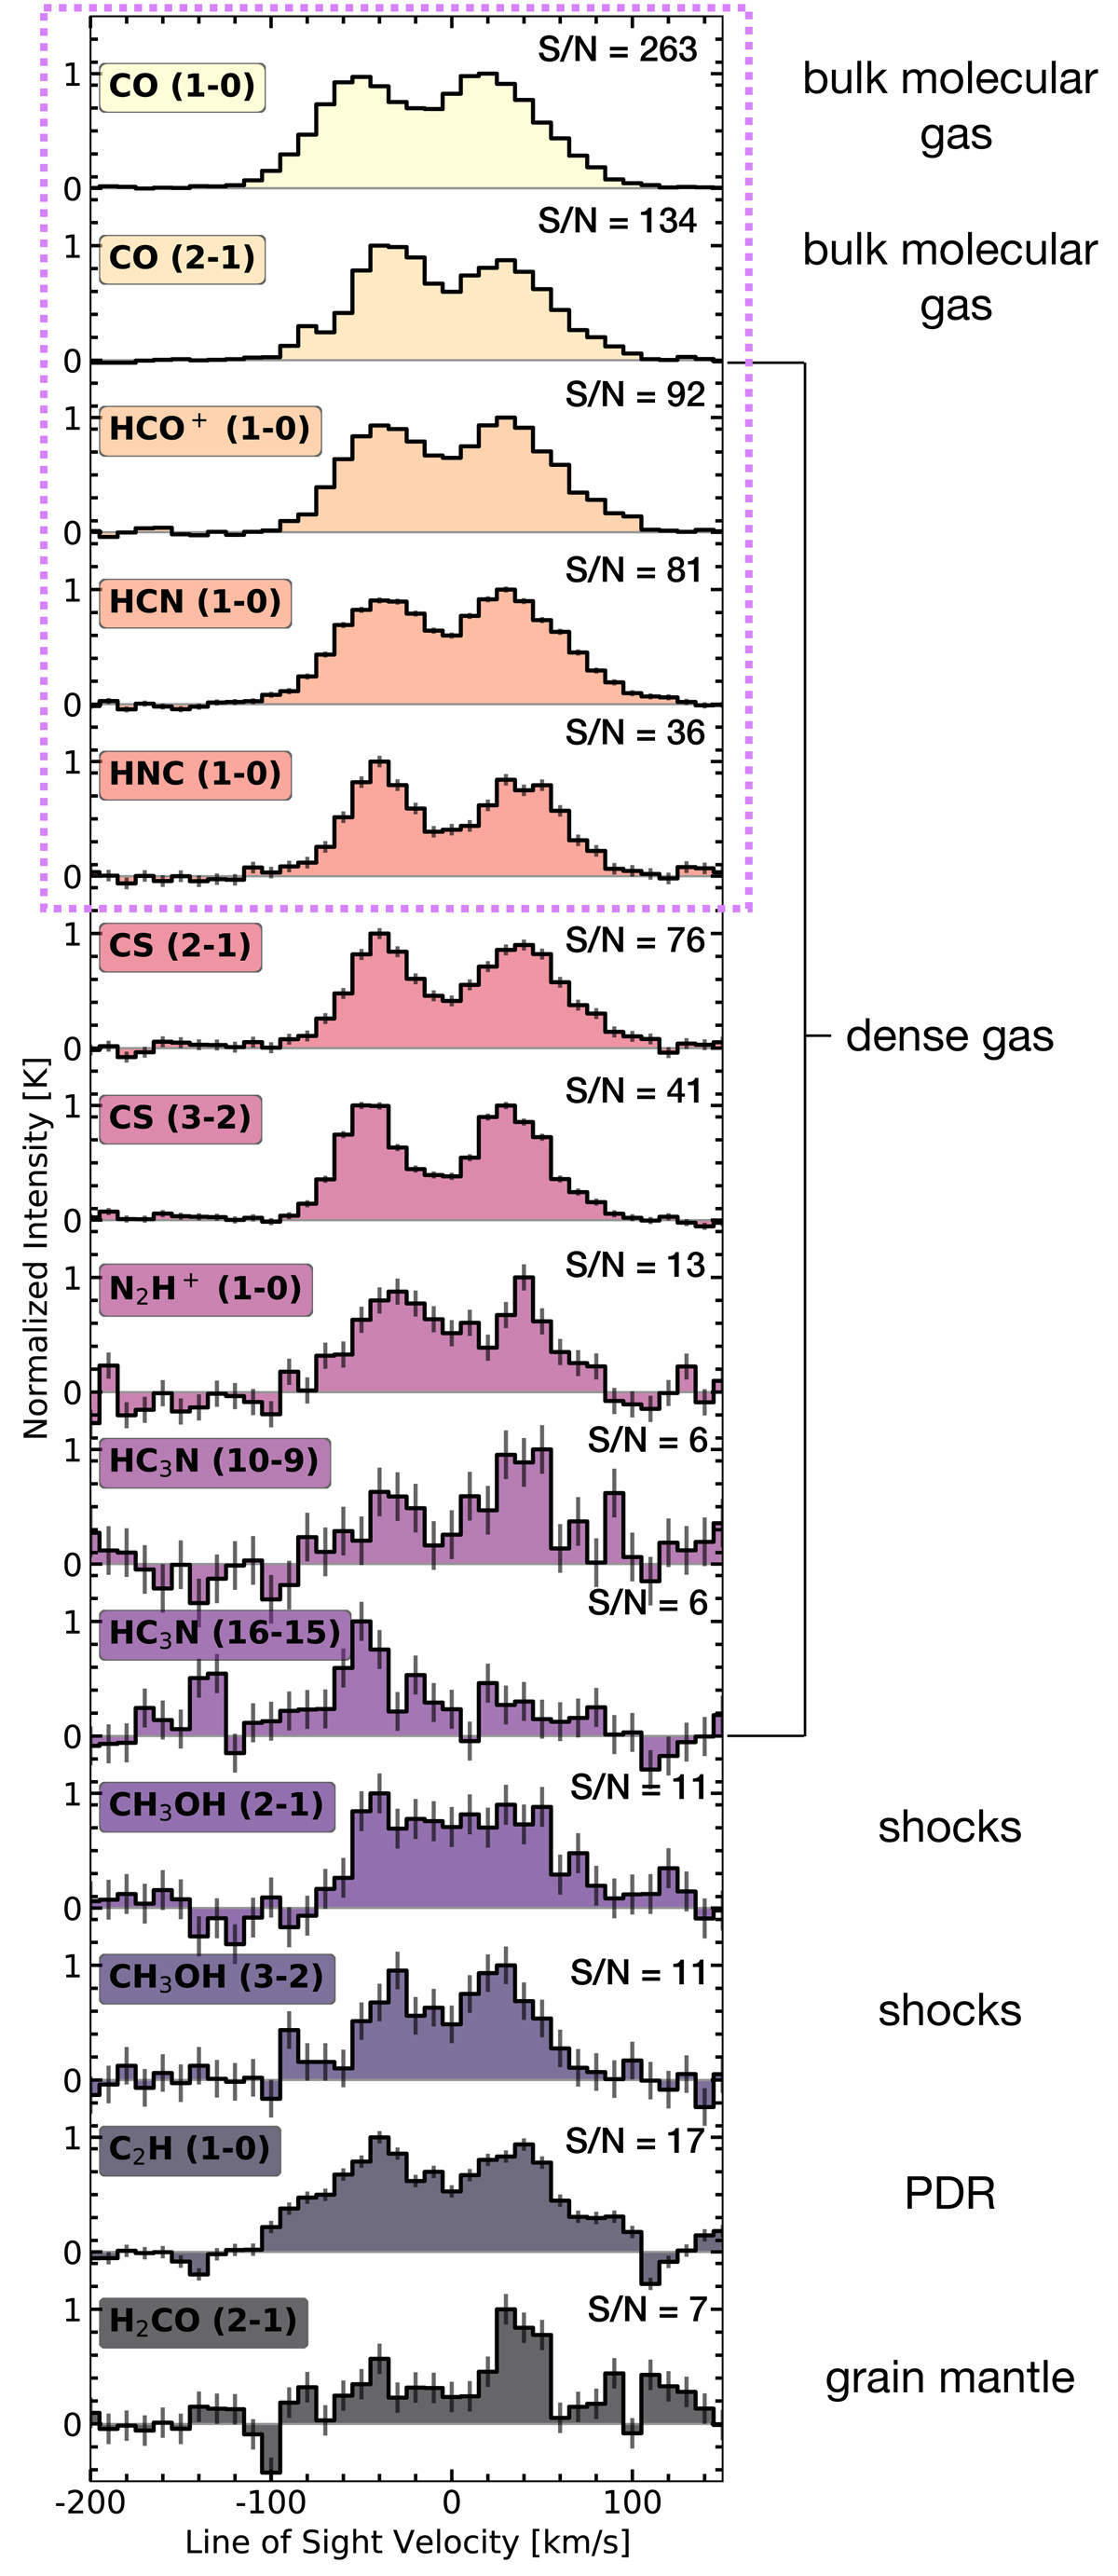
Fig. 3.

Download original image
Spectra of fourteen emission lines. We show the spectra of all the emission lines detected within this survey for the central sight line, i.e. aperture of 4″ ≈ 150 pc. The pink dotted rectangle shows the ones we use for discussing line ratio diagnostic plots later in this work (Sect. 6). We normalise all of them to the maximum value in their spectra. The right-hand side indicates what each molecule could be tracing according to literature (we refer the reader to the cautionary statements Sect. 3.2). Within each group we ordered the spectra by their S/N (see Table 3).
Current usage metrics show cumulative count of Article Views (full-text article views including HTML views, PDF and ePub downloads, according to the available data) and Abstracts Views on Vision4Press platform.
Data correspond to usage on the plateform after 2015. The current usage metrics is available 48-96 hours after online publication and is updated daily on week days.
Initial download of the metrics may take a while.


