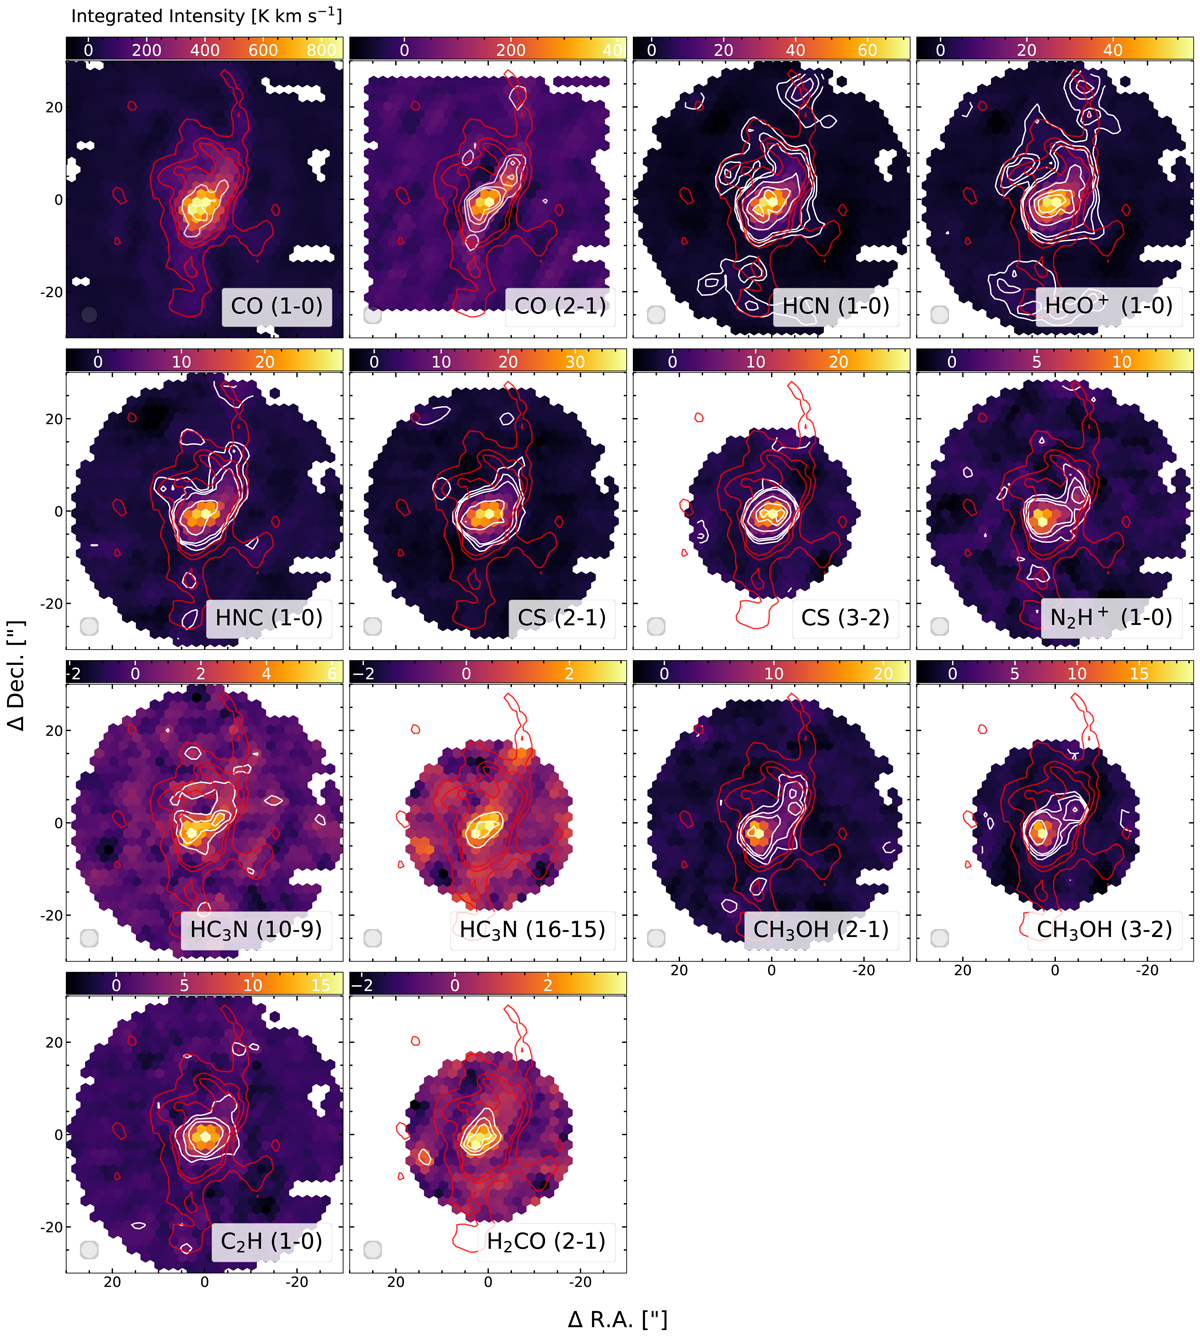
Fig. 2.
Download original image
Integrated intensity maps (moment 0) for 14 molecular emission lines at a common resolution of 4″ ≈ 150 pc. The maps were created using a hexagonal sampling with half a beam spacing, where CO(1−0) was used as a mask. The grey shaded circle in the lower left corner marks the beam size and the red contours show CO(1−0) S/N levels of 30, 60 and 90. The white contours in the first panel show S/N levels of 200 and 300, and in the second panel S/N levels of 30, 60 and 90. The following panels (from HCN to H2CO(2 − 1)) show S/N levels of 3, 6, 9, 30, 60 and 90. The colourbar indicates the integrated intensity of each line in units of K km s−1. See Table 1 for the properties of this data set.
Current usage metrics show cumulative count of Article Views (full-text article views including HTML views, PDF and ePub downloads, according to the available data) and Abstracts Views on Vision4Press platform.
Data correspond to usage on the plateform after 2015. The current usage metrics is available 48-96 hours after online publication and is updated daily on week days.
Initial download of the metrics may take a while.