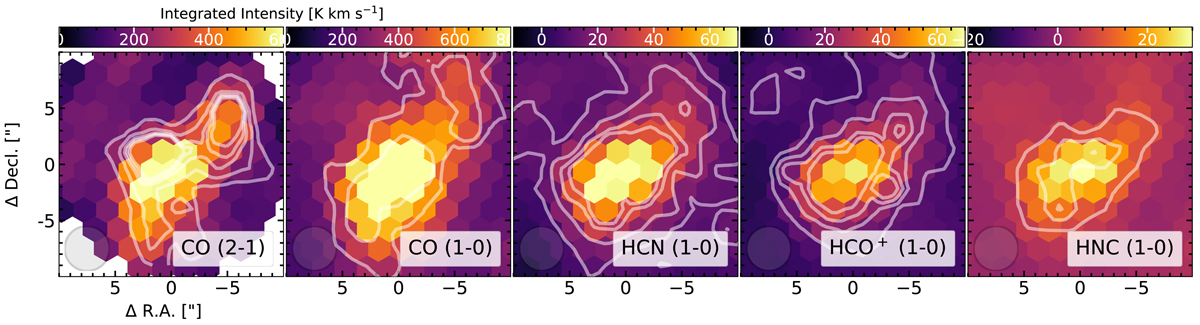
Fig. A.1.
Download original image
SSC + uv trim integrated intensity maps: The way of presenting the data is done as in Figure 2. Here, however, we performed a u − v cut and corrected for the short-spacing using available EMPIRE data for the three typical dense gas tracers. In the first two panels we show contours of 200, 300σ and in the remaining three panels contours of 3, 6, 9, 30, 60, 90σ.
Current usage metrics show cumulative count of Article Views (full-text article views including HTML views, PDF and ePub downloads, according to the available data) and Abstracts Views on Vision4Press platform.
Data correspond to usage on the plateform after 2015. The current usage metrics is available 48-96 hours after online publication and is updated daily on week days.
Initial download of the metrics may take a while.