Fig. 1.
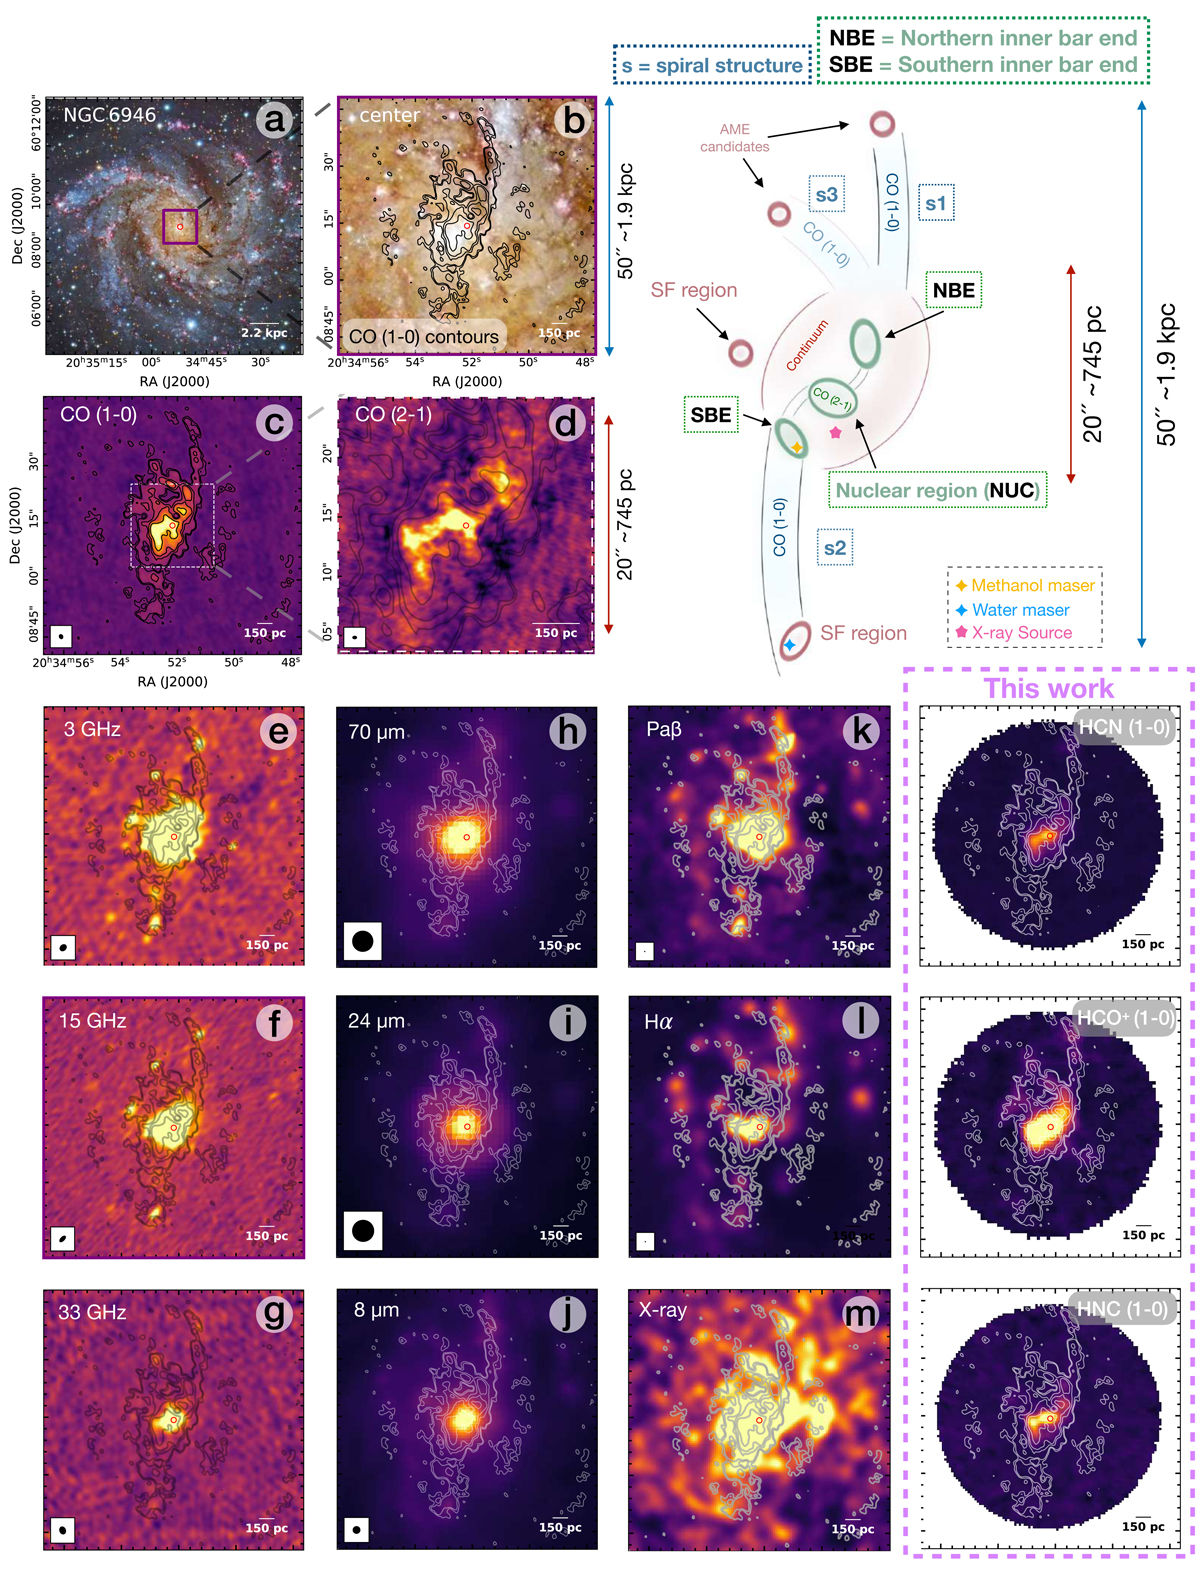
Download original image
Gallery of the multi-wavelength observation towards the centre of NGC 6946. Left panels: (a) three colour optical image, with the region of interest drawn as a purple box, (b) CO(1−0) emission shown in contours levels of 60, 90, 200, 300, 600 K km−1 s−1, and are repeated on all panels for comparison, (c) integrated CO(1−0) emission, (d) CO(2−1) emission towards the inner 20″ shown as colour scale; sketch (right): denoting all observed features (see Sect. 2.4 for an overview), (e)–(g) continuum emission, (h)–(j) infrared emission and (k)–(m) hydrogen recombination lines and X-ray emission (see Table A.1 for references of all observations shown). The rightmost column shows integrated intensity maps of three of our fourteen detected emission lines for comparison. Optical image credits: NASA, ESA, STScI, R. Gendler, and the Subaru Telescope (NAOJ).
Current usage metrics show cumulative count of Article Views (full-text article views including HTML views, PDF and ePub downloads, according to the available data) and Abstracts Views on Vision4Press platform.
Data correspond to usage on the plateform after 2015. The current usage metrics is available 48-96 hours after online publication and is updated daily on week days.
Initial download of the metrics may take a while.