Fig. 8.
Download original image
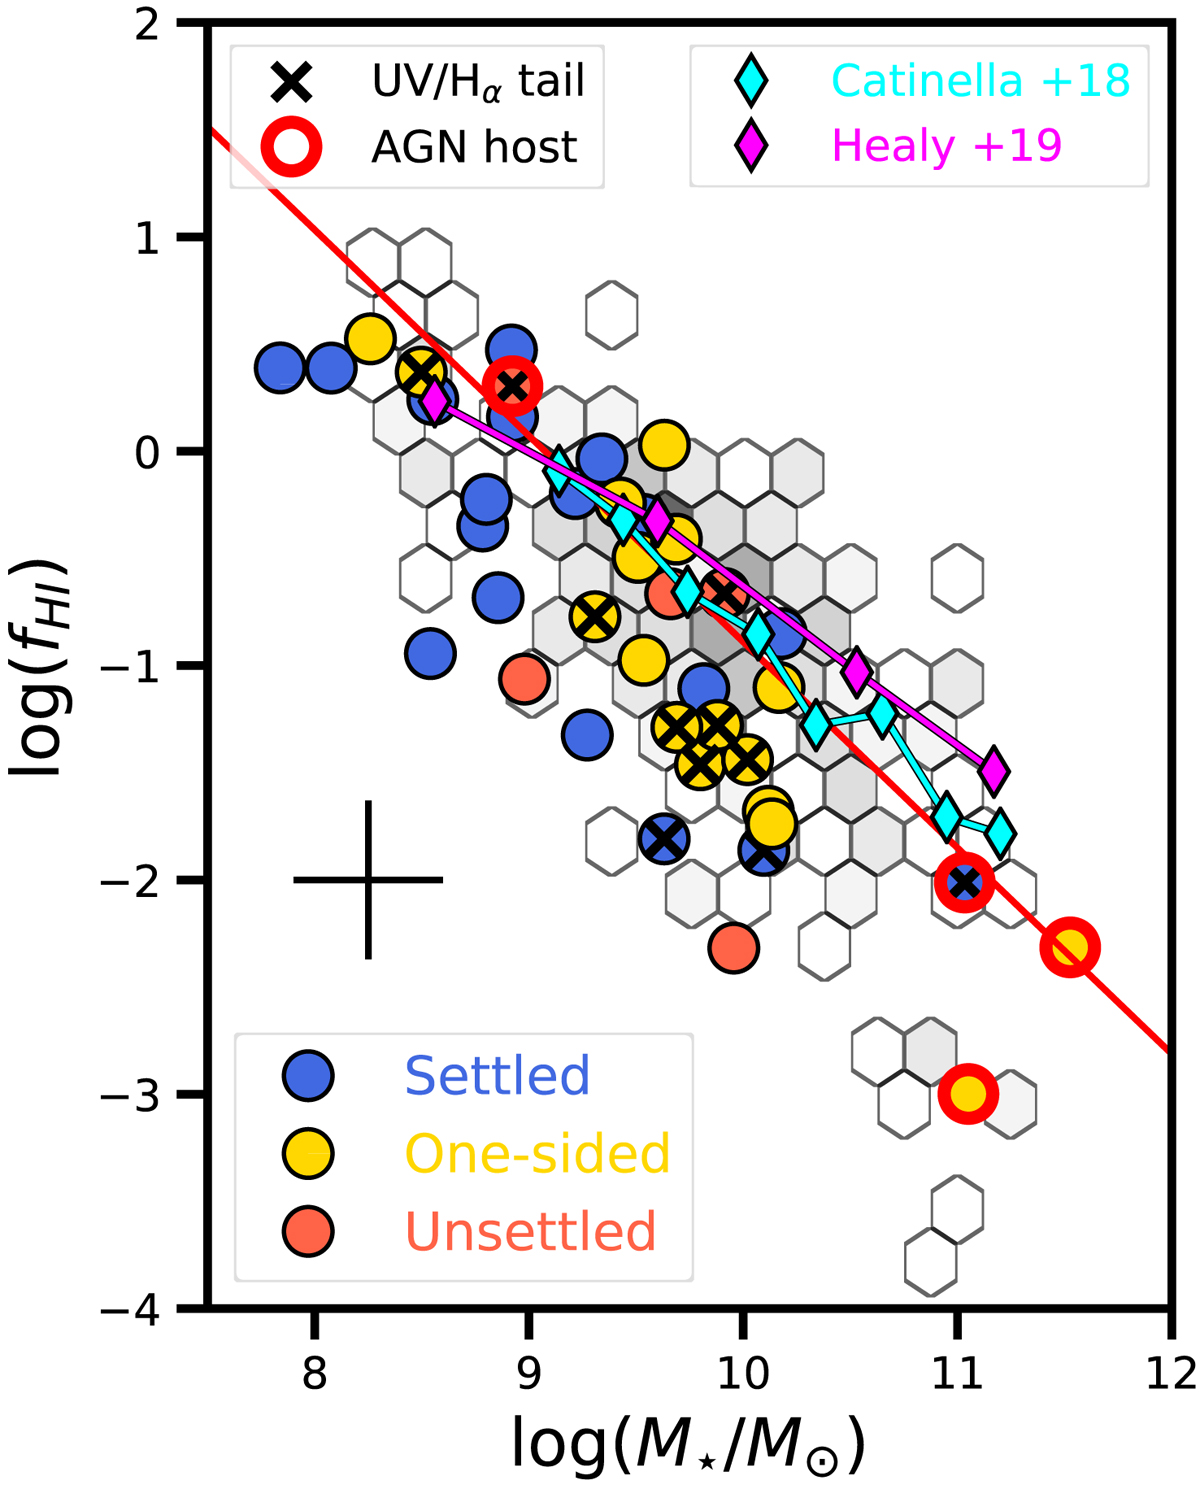
Distribution of H I-selected Coma galaxies (coloured circles) and the field galaxy reference sample (hexagonal bins) in the stellar mass – atomic gas fraction plane. Red line shows our best-fit linear relation to the SFMS galaxies (defined using Fig. 7) in the reference sample. Black crosses mark Coma galaxies with tails at Hα or UV wavelengths, while red circles denote ongoing AGN activity. Black errorbars are the mean uncertainties of the Coma measurements. The cyan and magenta diamonds indicate the median gas fractions measured by Catinella et al. (2018) and Healy et al. (2019), respectively.
Current usage metrics show cumulative count of Article Views (full-text article views including HTML views, PDF and ePub downloads, according to the available data) and Abstracts Views on Vision4Press platform.
Data correspond to usage on the plateform after 2015. The current usage metrics is available 48-96 hours after online publication and is updated daily on week days.
Initial download of the metrics may take a while.