Fig. 7.
Download original image
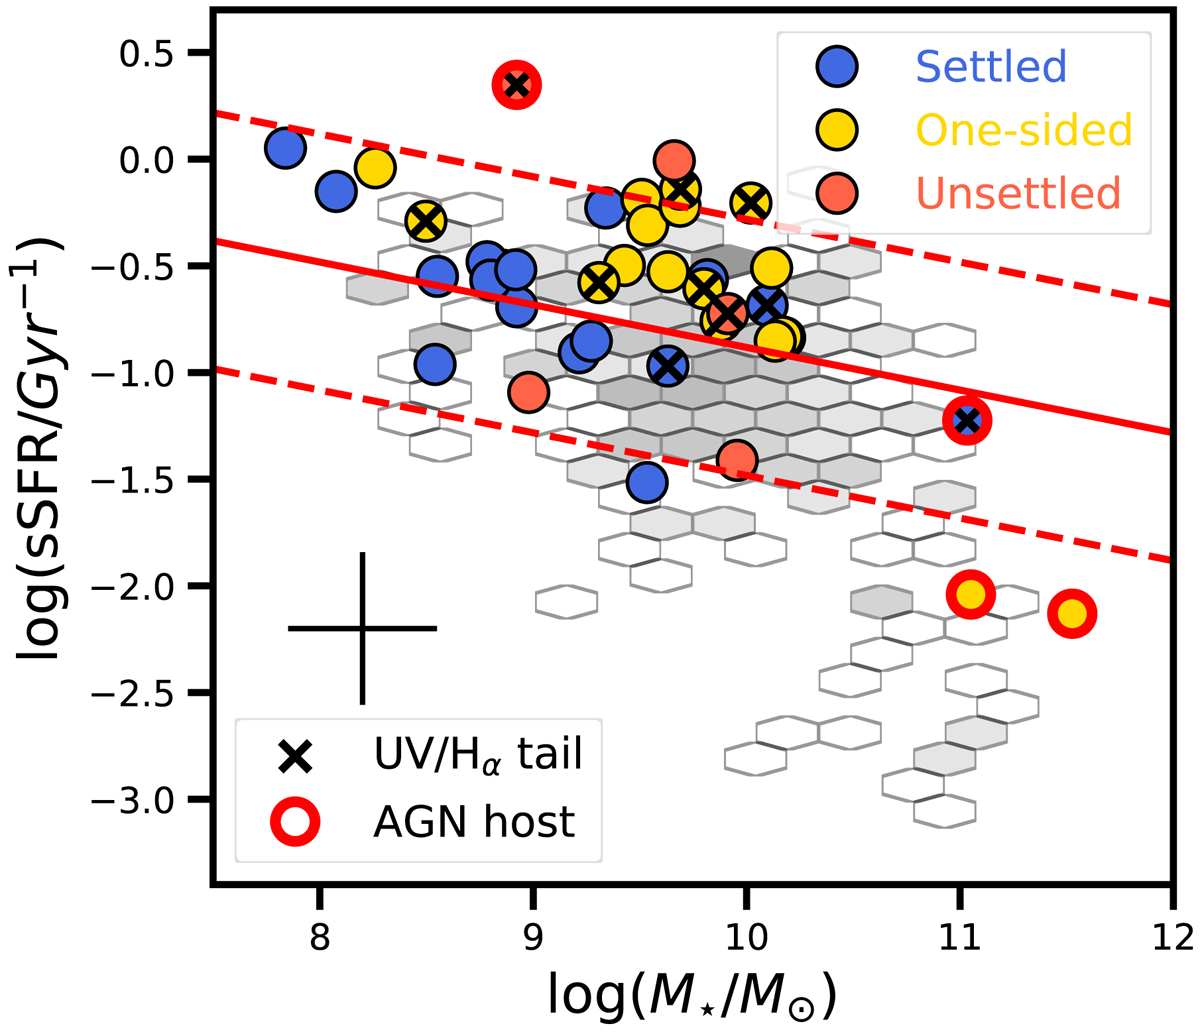
Distribution of H I-selected Coma galaxies (coloured circles) and the field galaxy reference sample (hexagonal bins indicating the number of sources in each bin with a logarithmic colourscale) in the stellar mass – specific star formation rate plane. The red line represents the z = 0 star forming main sequence relation of Sargent et al. (2014), while dashed lines above and below indicate the ±0.6 dex offset from SFMS. Black crosses mark Coma galaxies with tails at Hα (Yagi et al. 2010) or UV (Smith et al. 2010) wavelengths, while red circles denote ongoing AGN activity. Black errorbars are the mean uncertainties of the Coma measurements. Finally, red circles indicate galaxies identified as AGN in the literature (Mahajan et al. 2010; Gavazzi et al. 2011; Toba et al. 2014).
Current usage metrics show cumulative count of Article Views (full-text article views including HTML views, PDF and ePub downloads, according to the available data) and Abstracts Views on Vision4Press platform.
Data correspond to usage on the plateform after 2015. The current usage metrics is available 48-96 hours after online publication and is updated daily on week days.
Initial download of the metrics may take a while.