Fig. 5.
Download original image
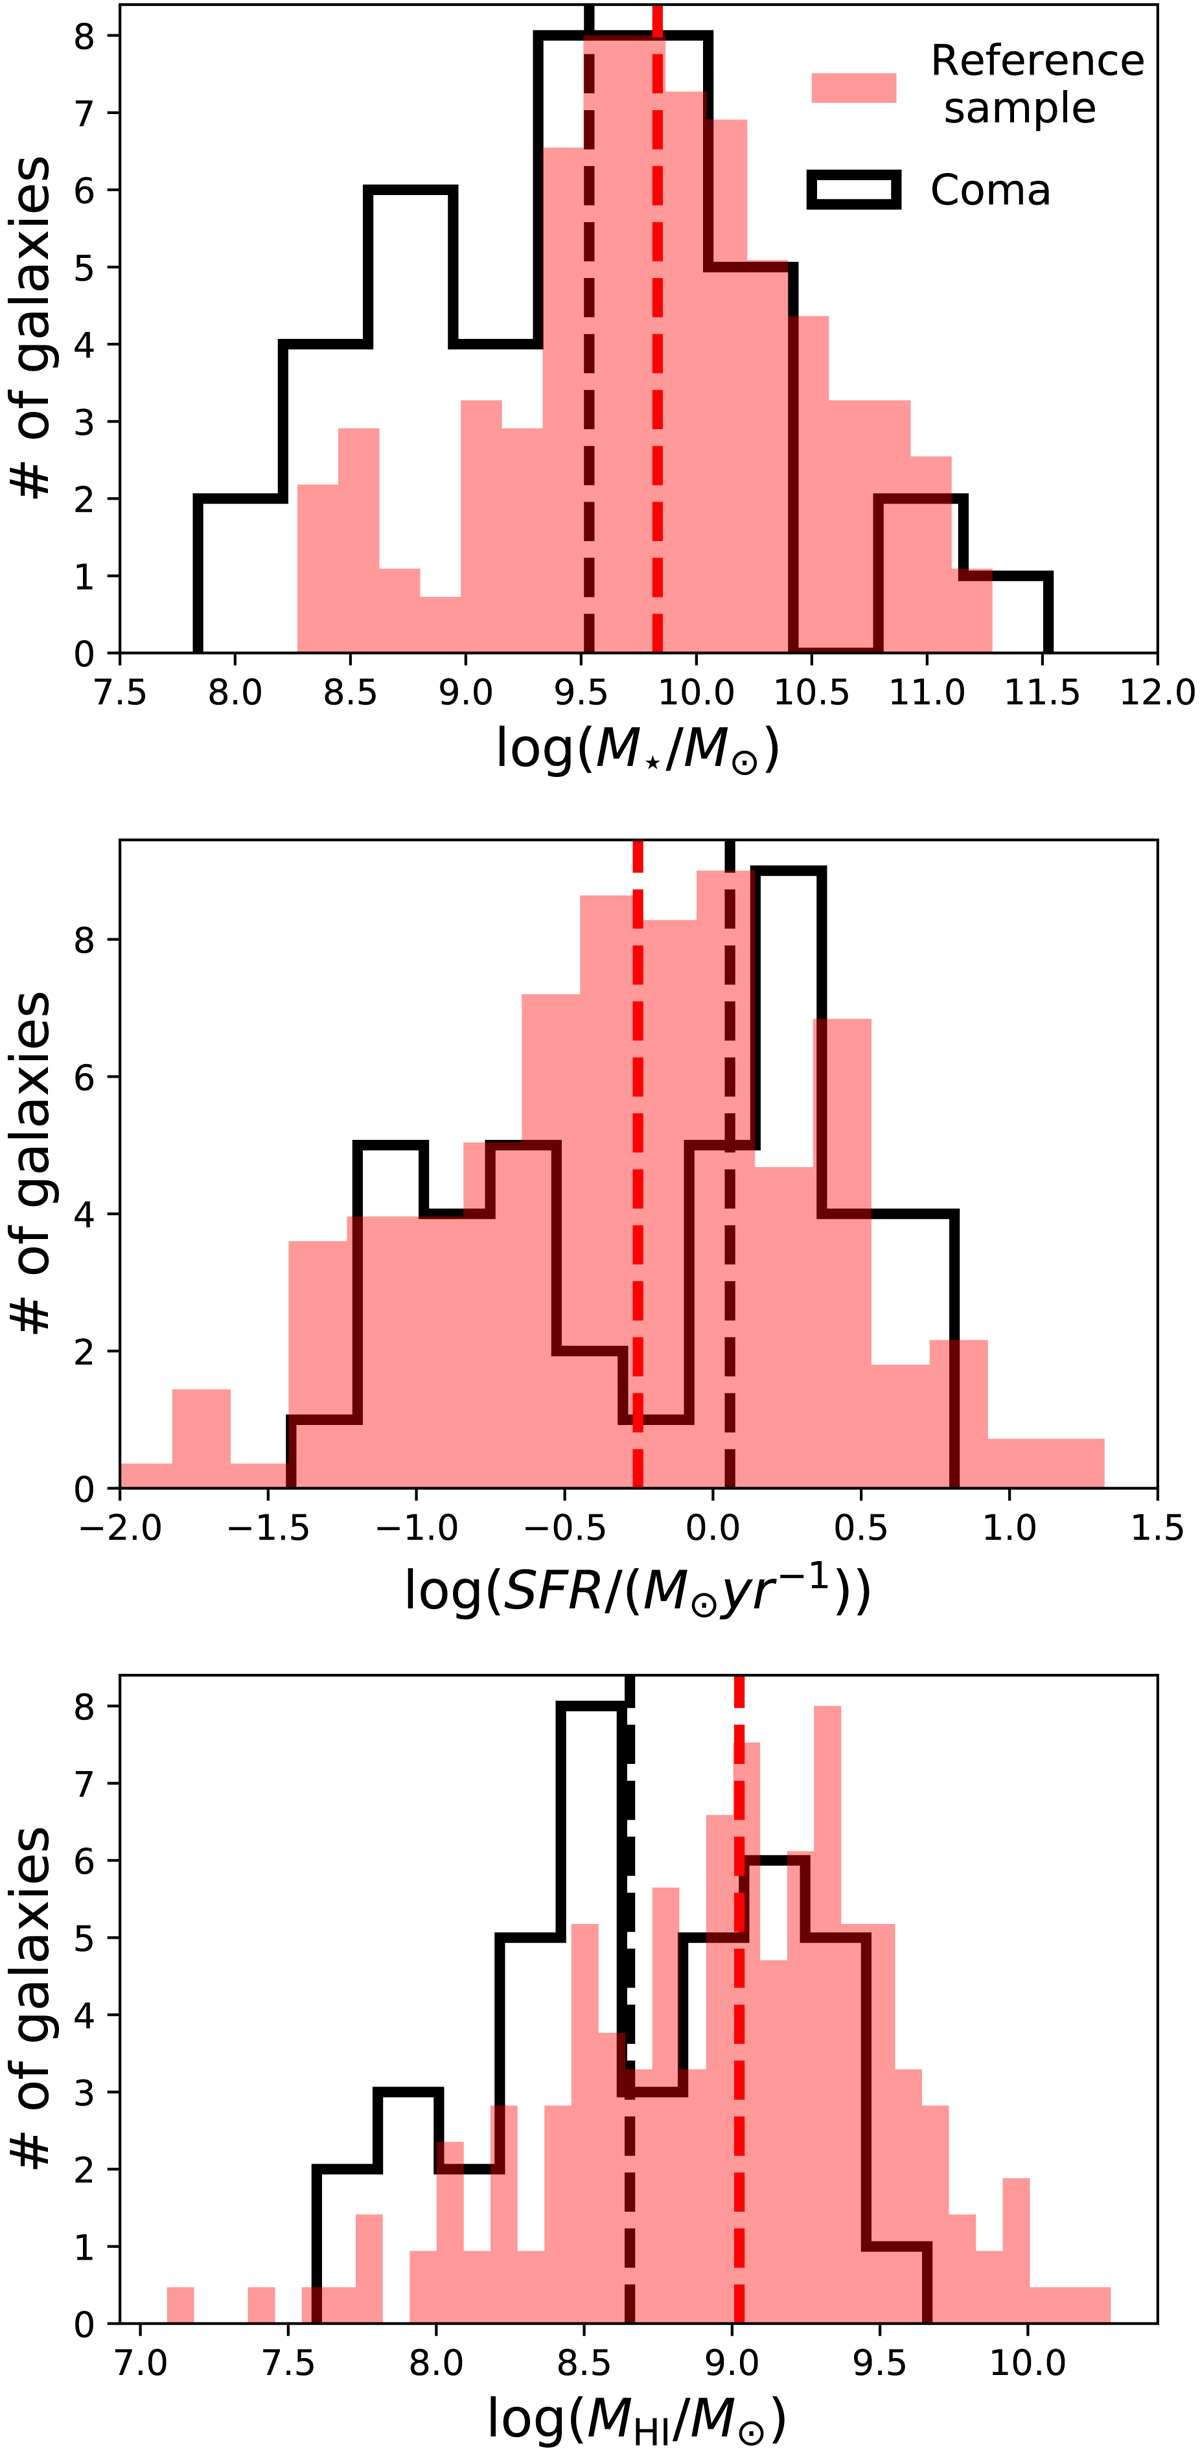
Distribution of stellar mass (top), SFR (middle), and MHI of H I-selected Coma galaxies (black) and the reference sample (red). The latter has been re-scaled to ease comparison. In each panel, black and red vertical dashed lines are drawn at the median values of the H I-selected Coma sample and the reference sample, respectively.
Current usage metrics show cumulative count of Article Views (full-text article views including HTML views, PDF and ePub downloads, according to the available data) and Abstracts Views on Vision4Press platform.
Data correspond to usage on the plateform after 2015. The current usage metrics is available 48-96 hours after online publication and is updated daily on week days.
Initial download of the metrics may take a while.