Fig. 3.
Download original image
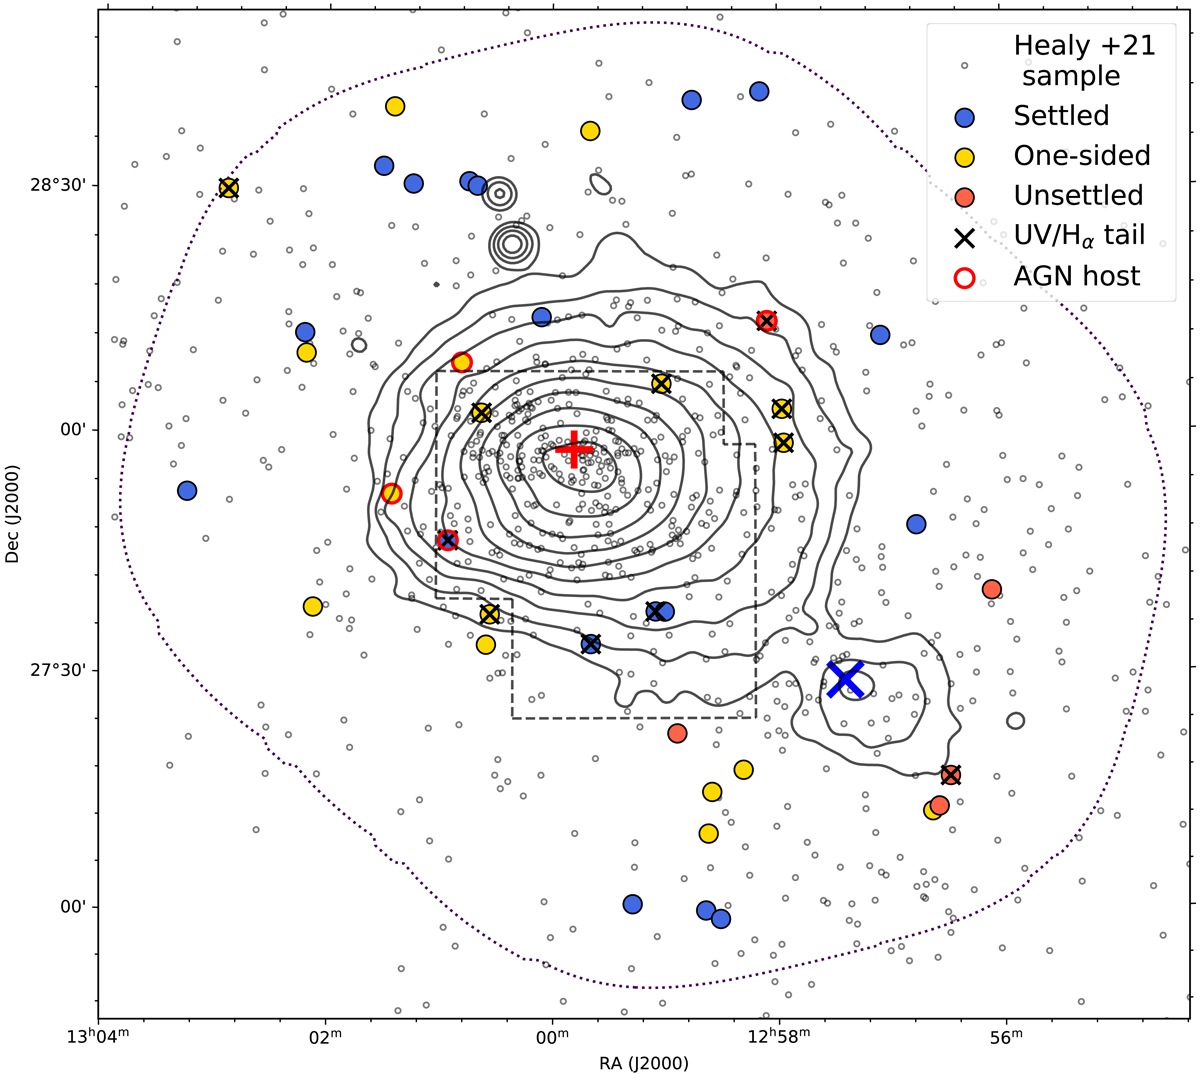
Position of H I-selected galaxies (coloured circles) in the plane of sky. Spectroscopically confirmed Coma members from Healy et al. (2021) are shown as grey circles. The red plus sign represents the centre of the Coma cluster, while the blue cross is placed at the position of NGC 4839. Solid black contours represent 2–7.2 keV X-ray distribution observed by XMM-Newton (Neumann et al. 2003). The lowest contour was drawn at 5 c s−1 deg−2, while subsequent contours are ![]() multiples of it. The dotted contour is drawn at the 25% of the peak primary beam sensitivity of our WSRT mosaic. Black crosses highlight sources with UV (Smith et al. 2010) and/or Hα (Yagi et al. 2010) tails. Dashed lines mark the Hα coverage of Yagi et al. (2010). All but one of our H I detections were found to have Hα tails within this region. Finally, red circles indicate galaxies identified as AGN in previous literature (Mahajan et al. 2010; Gavazzi et al. 2011; Toba et al. 2014).
multiples of it. The dotted contour is drawn at the 25% of the peak primary beam sensitivity of our WSRT mosaic. Black crosses highlight sources with UV (Smith et al. 2010) and/or Hα (Yagi et al. 2010) tails. Dashed lines mark the Hα coverage of Yagi et al. (2010). All but one of our H I detections were found to have Hα tails within this region. Finally, red circles indicate galaxies identified as AGN in previous literature (Mahajan et al. 2010; Gavazzi et al. 2011; Toba et al. 2014).
Current usage metrics show cumulative count of Article Views (full-text article views including HTML views, PDF and ePub downloads, according to the available data) and Abstracts Views on Vision4Press platform.
Data correspond to usage on the plateform after 2015. The current usage metrics is available 48-96 hours after online publication and is updated daily on week days.
Initial download of the metrics may take a while.