Fig. 2.
Download original image
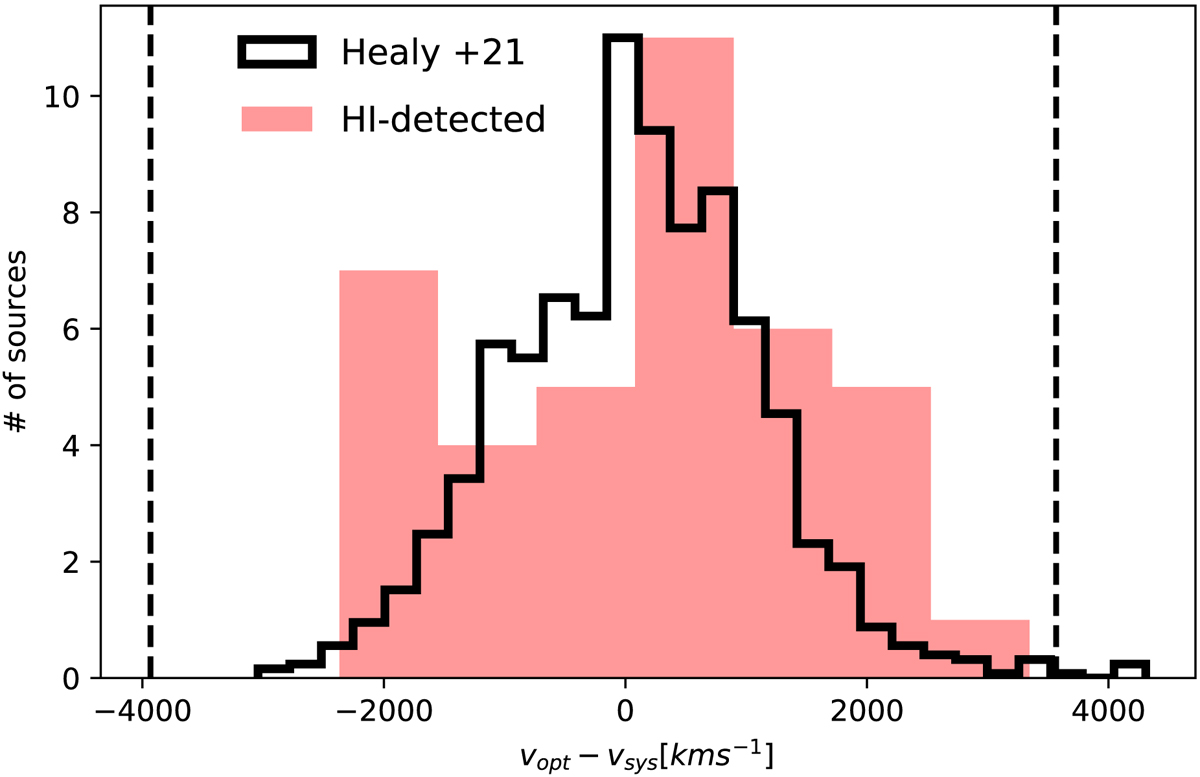
Distribution of line of sight velocities relative to the systemic velocity of the Coma cluster. The red shaded histogram shows H I-selected galaxies in our WSRT survey while the black one represents confirmed Coma members based on the optical spectroscopy by Healy et al. (2021). The latter has been re-scaled to ease comparison. Dashed vertical lines mark the minimum and maximum velocities at which the WCS can detect H I emission. For more details on optical association see Sect. 2.3.
Current usage metrics show cumulative count of Article Views (full-text article views including HTML views, PDF and ePub downloads, according to the available data) and Abstracts Views on Vision4Press platform.
Data correspond to usage on the plateform after 2015. The current usage metrics is available 48-96 hours after online publication and is updated daily on week days.
Initial download of the metrics may take a while.