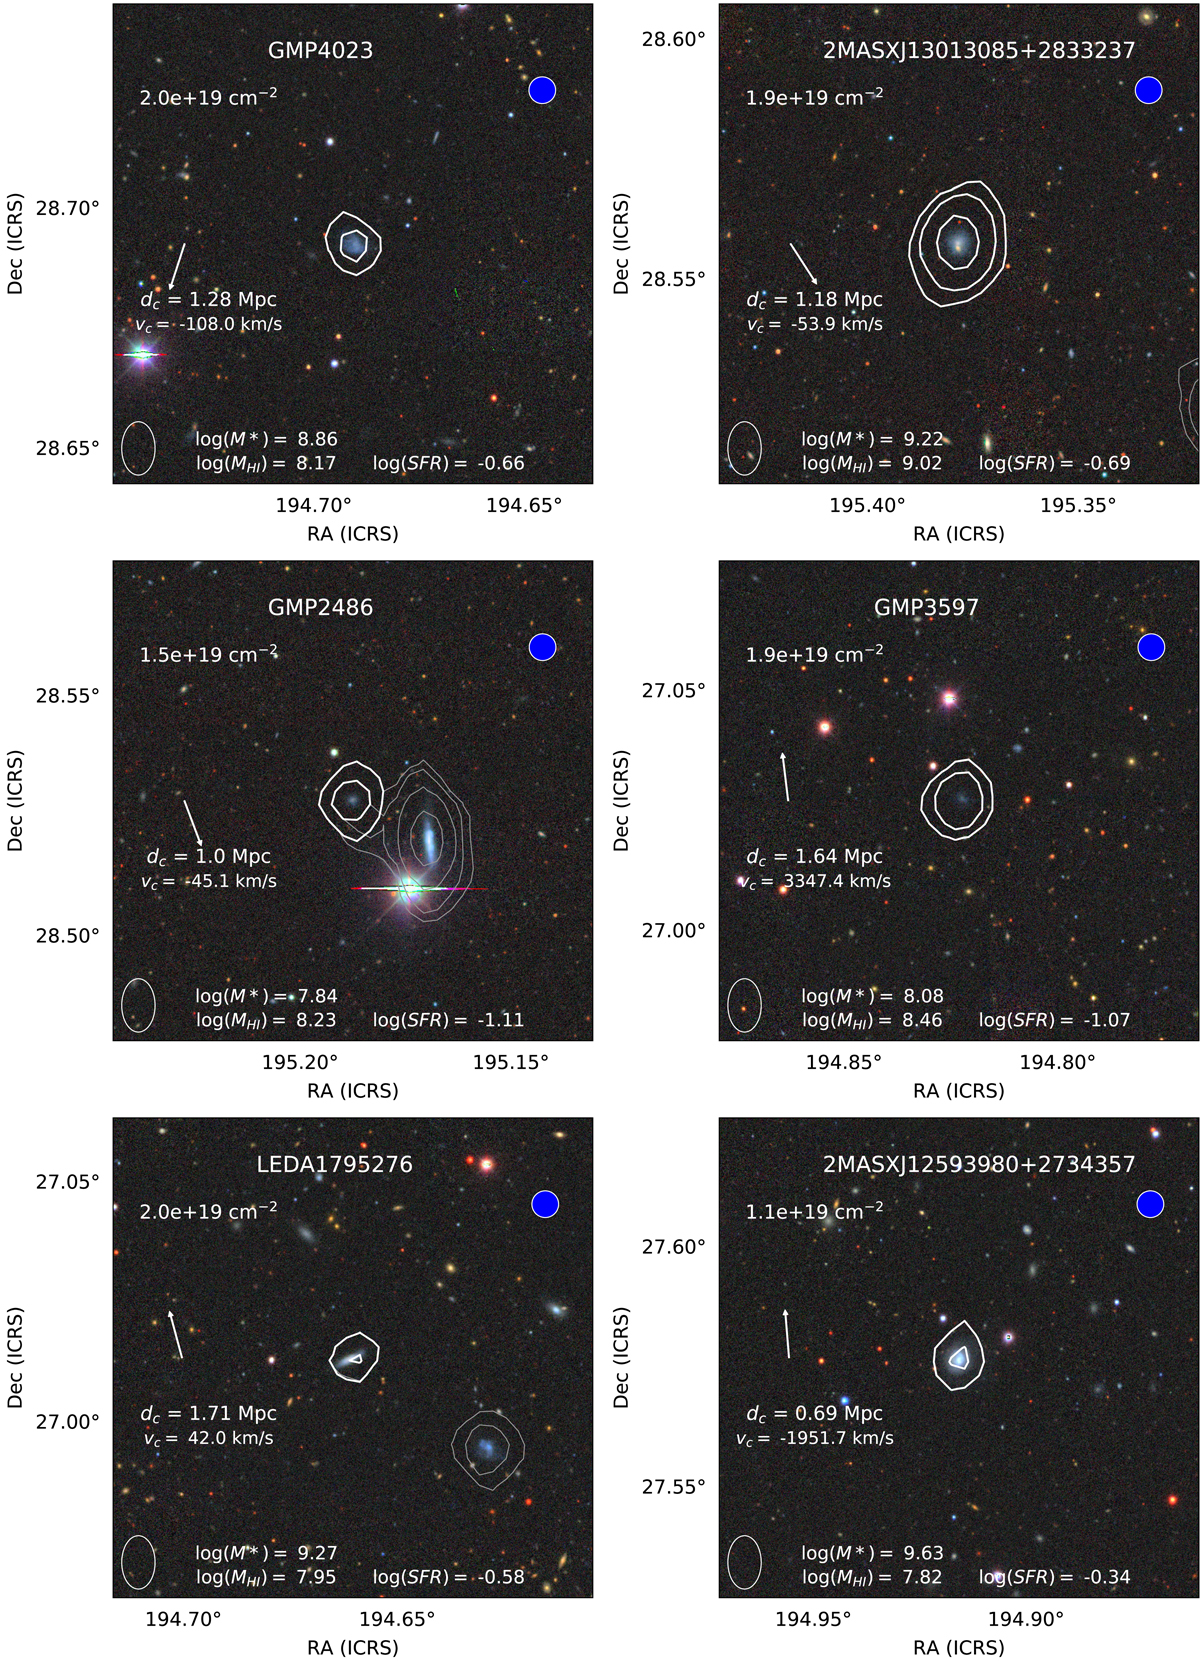
Fig. B.1.
Download original image
Integrated intensity distribution of H I overlaid on DECalS g, r, z image. White column density contours outline the detection showcased by the panel. Grey contours are background or foreground H I sources. Lowest contour is shown in the top left. All other contours are 3n multiples of it. The SFR, stellar, and H I masses are in the bottom of each image. The arrow points towards the centre of the Coma cluster, with its projected distance in Mpc (dc) and the H I source’s velocity offset relative to the systemic velocity of the cluster (vc). The WSRT synthesised beam is in the lower left corner. Fully coloured circles indicate the H I morphological classes: settled (blue), one-sided asymmetry (yellow), or unsettled (red).
Current usage metrics show cumulative count of Article Views (full-text article views including HTML views, PDF and ePub downloads, according to the available data) and Abstracts Views on Vision4Press platform.
Data correspond to usage on the plateform after 2015. The current usage metrics is available 48-96 hours after online publication and is updated daily on week days.
Initial download of the metrics may take a while.