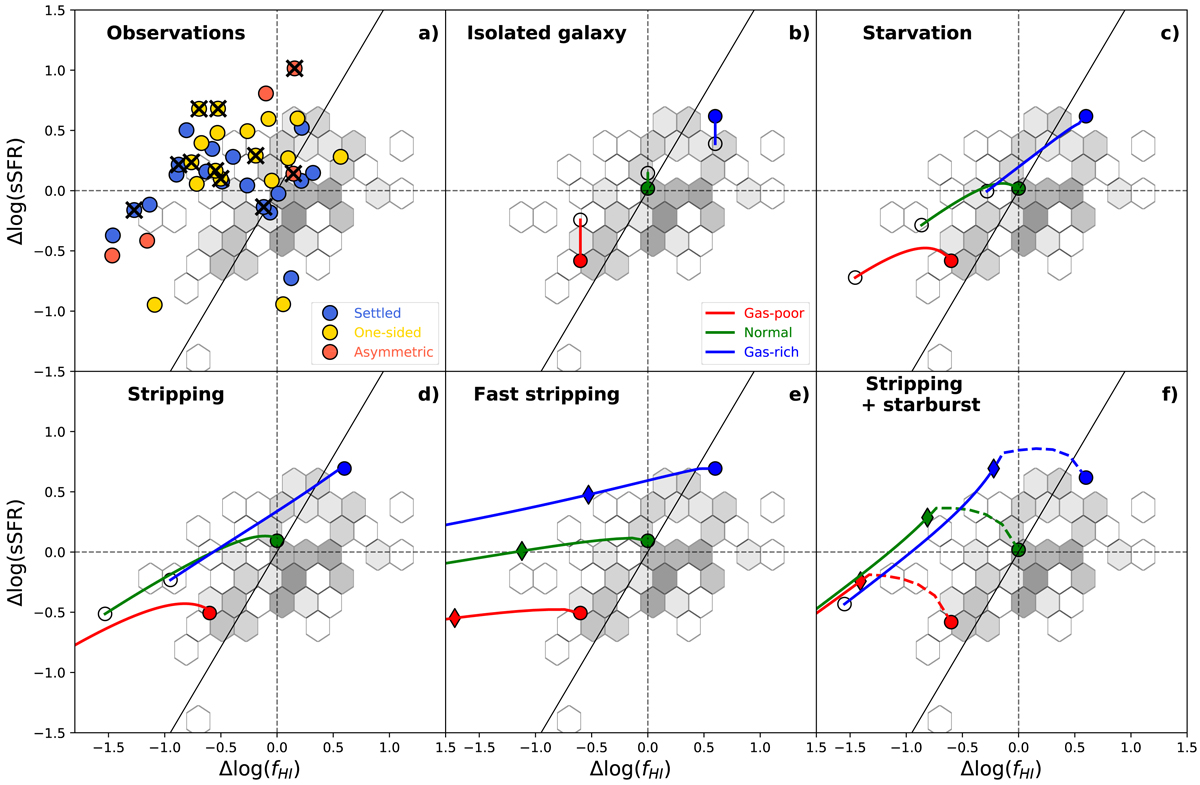
Fig. 12.
Download original image
Simulated trajectories of galaxies in the ΔsSFR – ΔfHI space represented by red, green, and blue curves with filled circles marking the gas-poor, normal, and gas-rich starting points, respectively, while empty circles are the end states. Hexagonal bins show the reference sample with the black line as its best-fit correlation. The top left panel a) shows our H I-selected sample as seen in Fig. 9. Each subsequent panel demonstrates a different scenario of galaxy evolution as described in Sect. 5.1. Specifically, b) represents a field galaxy with atomic gas accretion, c) has no H I replenishment or removal, d) shows H I stripping on timescales comparable with the H I-to-H2 conversion timescale, e) shortens this timescale by a factor of 10, while f) adds a 300 Myr starburst episode to the models of e) with a factor 8 enhancement to the H I-to-H2 conversion efficiency. In panels e) and f) diamonds indicate the model states after 300 Myr, and in panel f) dashed lines highlight the starburst phases.
Current usage metrics show cumulative count of Article Views (full-text article views including HTML views, PDF and ePub downloads, according to the available data) and Abstracts Views on Vision4Press platform.
Data correspond to usage on the plateform after 2015. The current usage metrics is available 48-96 hours after online publication and is updated daily on week days.
Initial download of the metrics may take a while.