Fig. 6.
Download original image
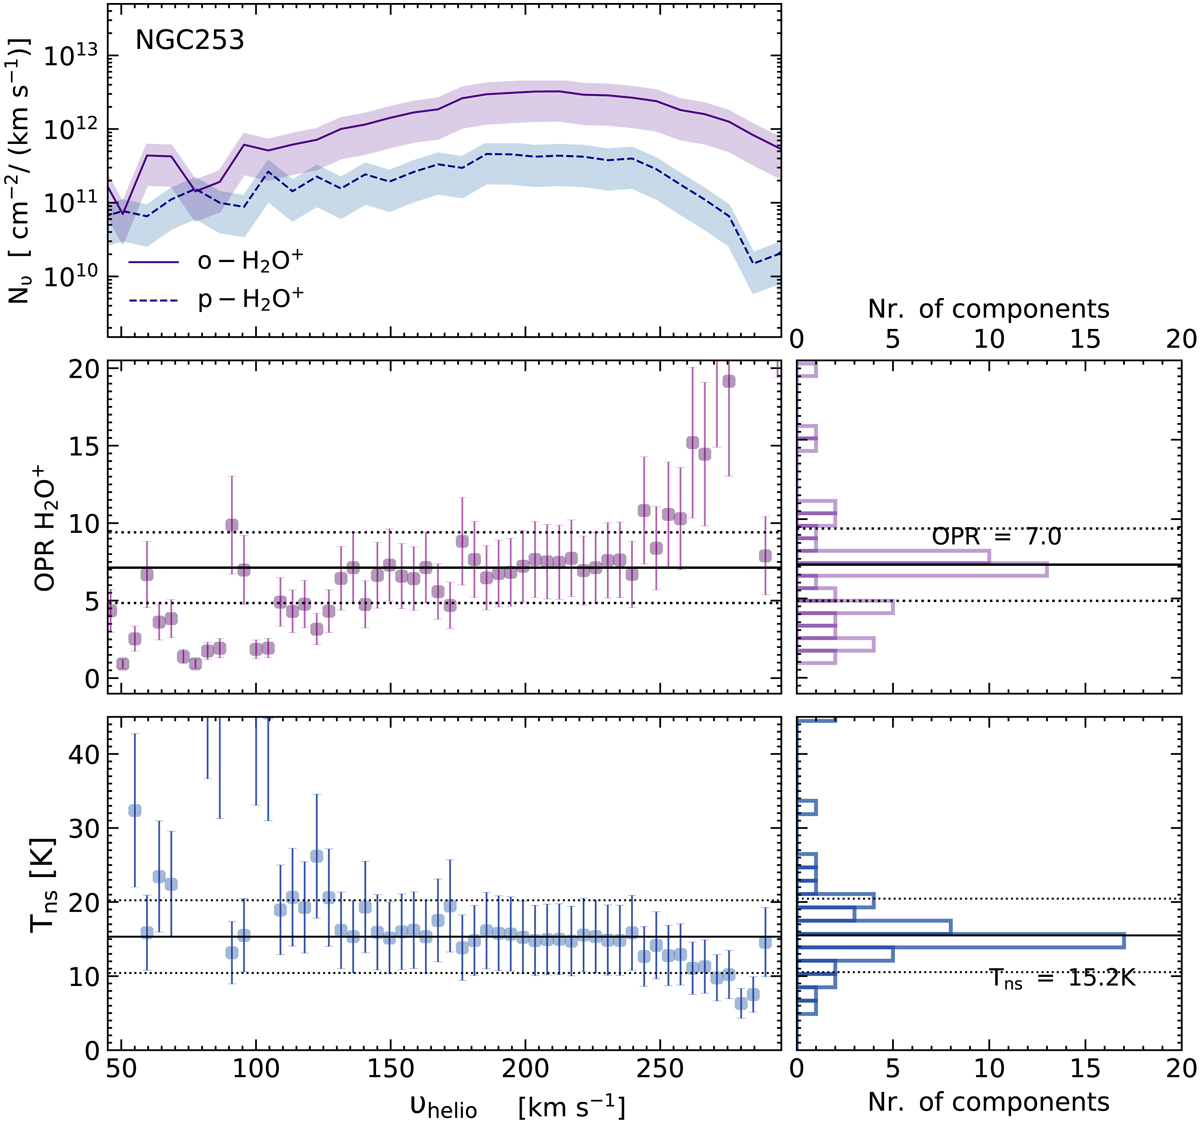
Top panel: column density per velocity interval distribution of o-H2O+ (solid purple) and p-H2O+ (dashed blue) over the entire velocity interval covering absorption towards NGC 253. Middle panel: OPR H2O+ distribution (left) and corresponding histogram (right). Bottom panel: nuclear spin temperature distribution (left) and corresponding histogram (right). The median and 1 σ levels of the OPR and nuclear spin temperature are marked by solid and dotted black lines, respectively.
Current usage metrics show cumulative count of Article Views (full-text article views including HTML views, PDF and ePub downloads, according to the available data) and Abstracts Views on Vision4Press platform.
Data correspond to usage on the plateform after 2015. The current usage metrics is available 48-96 hours after online publication and is updated daily on week days.
Initial download of the metrics may take a while.