Fig. 4.
Download original image
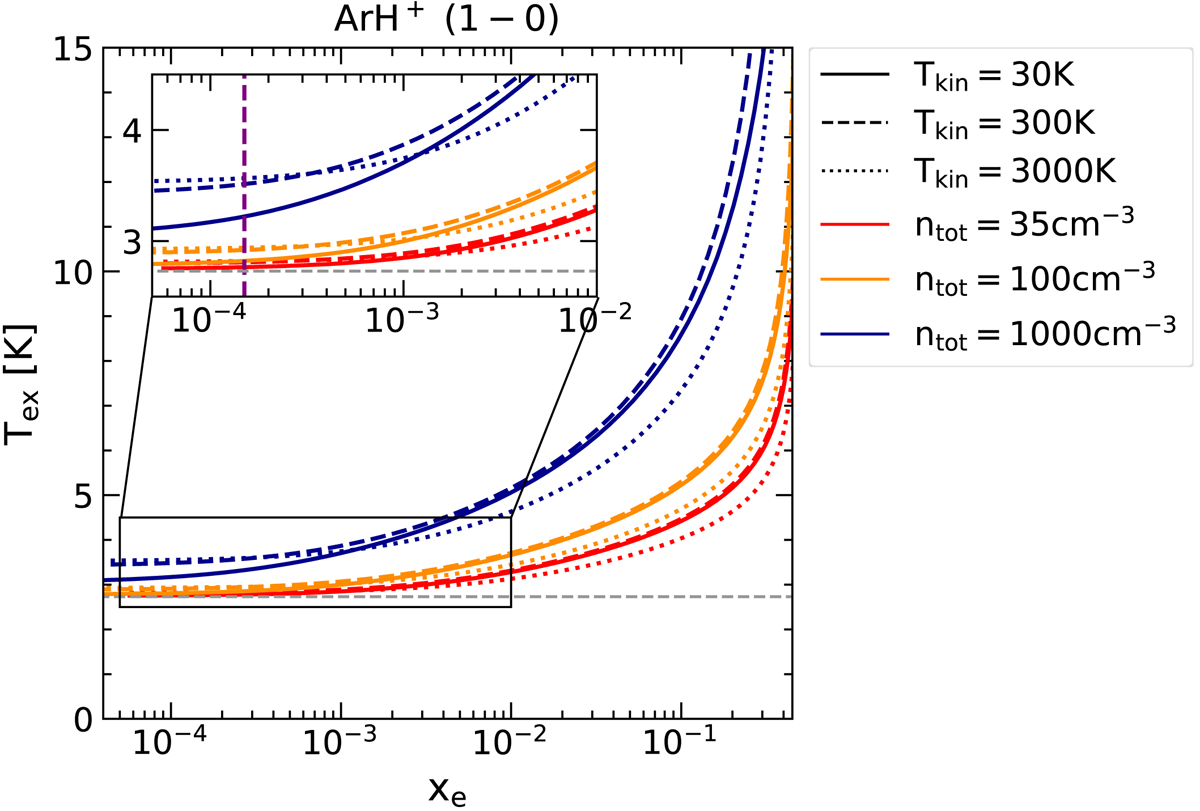
RADEX modelled excitation temperature as a function of electron density, for fixed values of the total gas density at 35 (red), 100 (orange) and 1000 cm−3 (dark blue) for the ArH+ (1–0) transition. Furthermore, each model is run for fixed gas temperatures at 30 (solid), 300 (dashed) and 3000 K (dotted), respectively. The horizontal dashed grey line marks an excitation temperature of 2.73 K. The inset zooms in on 10−4 < xe < 10−2 with the vertical dashed purple line indicating xe = 1.5 × 10⁻⁴ which corresponds to the value of xe used in our calculations.
Current usage metrics show cumulative count of Article Views (full-text article views including HTML views, PDF and ePub downloads, according to the available data) and Abstracts Views on Vision4Press platform.
Data correspond to usage on the plateform after 2015. The current usage metrics is available 48-96 hours after online publication and is updated daily on week days.
Initial download of the metrics may take a while.