Fig. 3.
Download original image
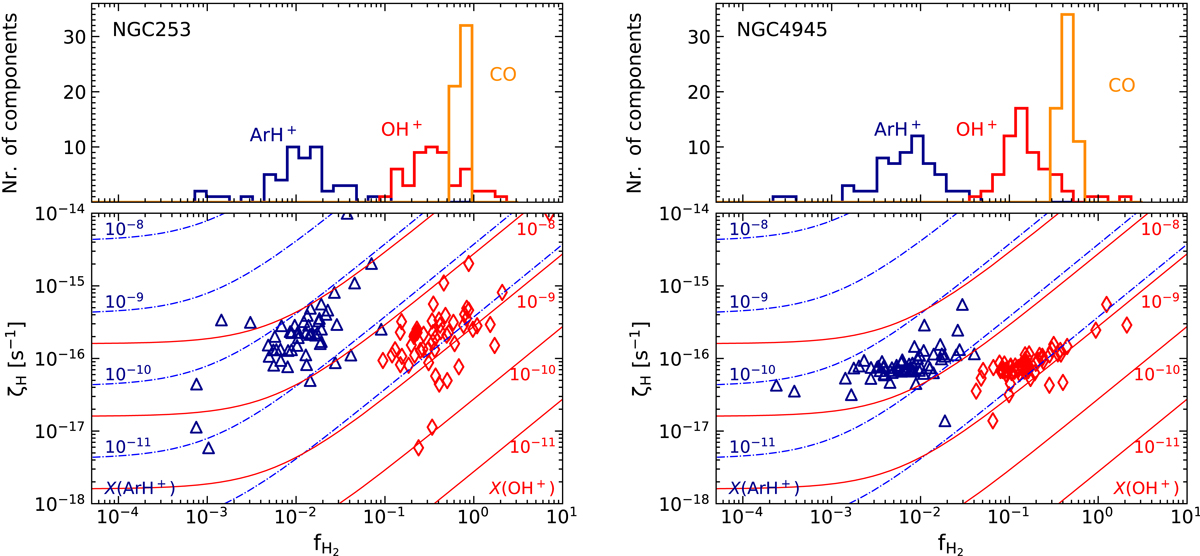
Top: distribution of molecular gas fraction (fH2) traced by ArH+ (blue), OH+ (red) and CO (orange). Bottom: contours of X(ArH+) (blue) and X(OH+) (red) abundances with respect to NH in the fH2–ζp(H) plane. Blue triangles and red diamonds represent the corresponding values derived from the LOS observations presented in this work computed per channel in the velocity interval (Δυ ∼ 4.5 km s−1) between 55 and 295 km s−1, and 445 and 725 km s−1 for NGC 253 and NGC 4945, respectively.
Current usage metrics show cumulative count of Article Views (full-text article views including HTML views, PDF and ePub downloads, according to the available data) and Abstracts Views on Vision4Press platform.
Data correspond to usage on the plateform after 2015. The current usage metrics is available 48-96 hours after online publication and is updated daily on week days.
Initial download of the metrics may take a while.