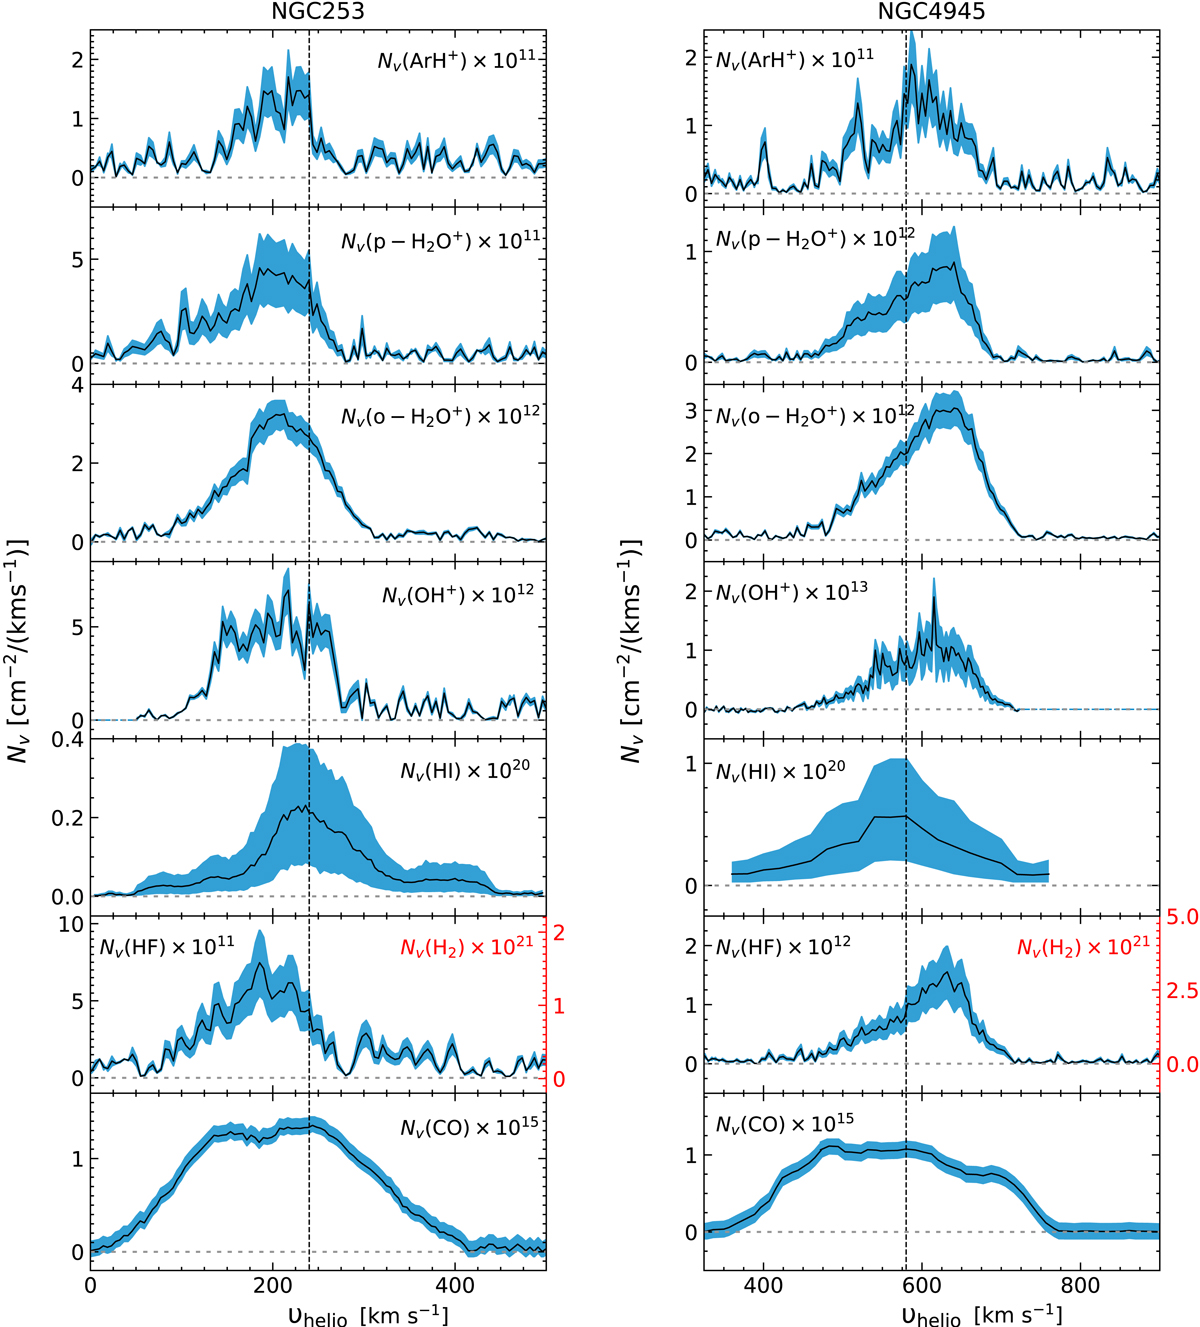
Fig. 2.
Download original image
From top to bottom: column density distributions (black) of ArH+, p-H2O+, o-H2O+, OH+, HI, HF alongside the corresponding scaled H2 profile ([HF]/[H2] = 5×10⁻¹⁰; Emprechtinger et al. 2012) and CO towards NGC 253 (left) and NGC 4945 (right), respectively. The corresponding uncertainties are displayed by the blue shaded region.
Current usage metrics show cumulative count of Article Views (full-text article views including HTML views, PDF and ePub downloads, according to the available data) and Abstracts Views on Vision4Press platform.
Data correspond to usage on the plateform after 2015. The current usage metrics is available 48-96 hours after online publication and is updated daily on week days.
Initial download of the metrics may take a while.