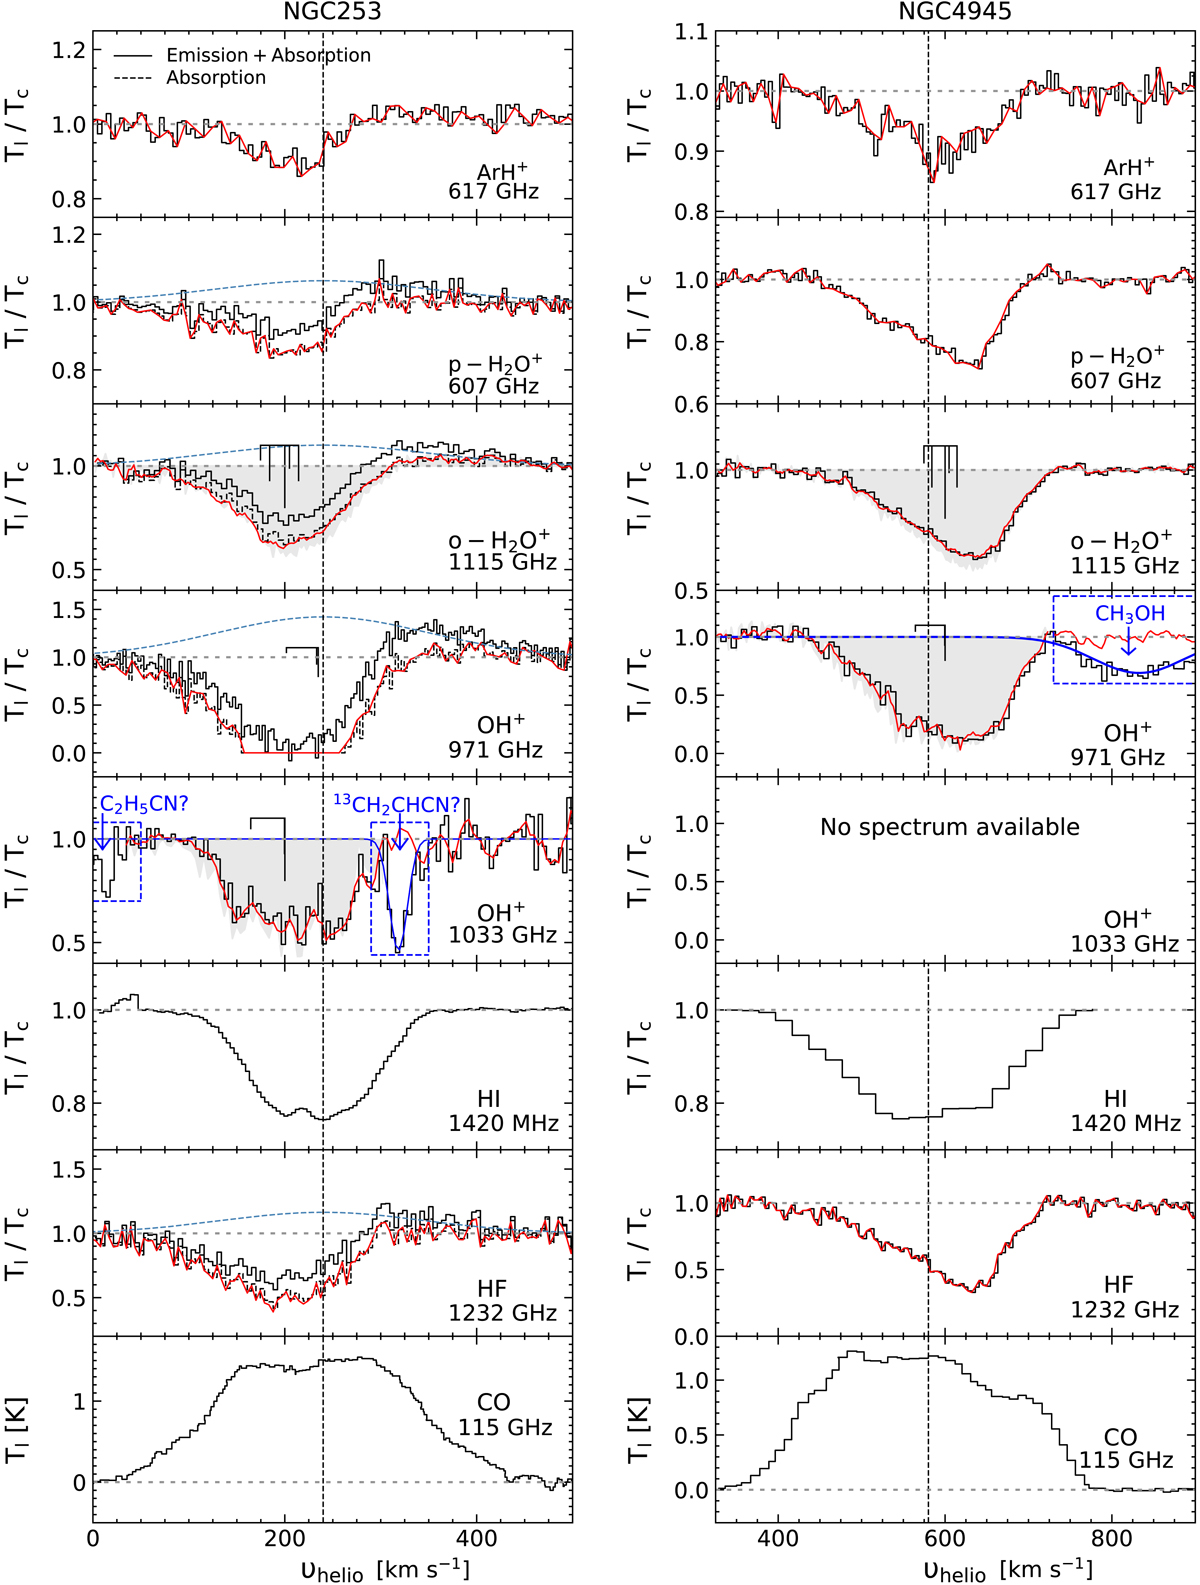
Fig. 1.
Download original image
From top to bottom: normalised absorption spectra of ArH+, p-H2O+, o-H2O+, OH+ (at 971 and 1033 GHz), HI and HF as well as the CO (1–0) emission line spectrum for comparison, towards NGC 253 (left) and NGC 4945 (right), respectively. In the spectra for NGC 253, the dotted light blue curves display the Gaussian fit to the emission component. The dashed black line represents the individual absorption profiles after subtracting the Gaussian fit with their Wiener filter fits overlaid in red for all species except HI and CO. The relative intensities of the hyperfine structure (HFS) components of the o-H2O+ and OH+ transitions are shown in black above their respective spectra and the grey shaded regions display their HFS deconvolved spectra. The vertical dashed black lines mark the systemic velocity of NGC 253 and NGC 4945 at 240 km s−1 and 563 km s−1, respectively. The 971 GHz OH+ line profile towards NGC 253 is saturated at blueshifted velocities while the 1033 GHz OH+ spectrum is potentially contaminated by the 13CH2CHCN (2110,11–209,12) line at 1032.783 GHz (fit shown by the dark blue curve). Also marked here in blue is contamination from the C2H5CN (379,29–376,32) line at 1033.868 GHz. The 971 GHz OH+ spectrum towards NGC 4945 is contaminated by the CH3OH Jk = 94,6 − 8,53 E line near 959.900 GHz originating from the image sideband (marked in blue).
Current usage metrics show cumulative count of Article Views (full-text article views including HTML views, PDF and ePub downloads, according to the available data) and Abstracts Views on Vision4Press platform.
Data correspond to usage on the plateform after 2015. The current usage metrics is available 48-96 hours after online publication and is updated daily on week days.
Initial download of the metrics may take a while.