Fig. 5.
Download original image
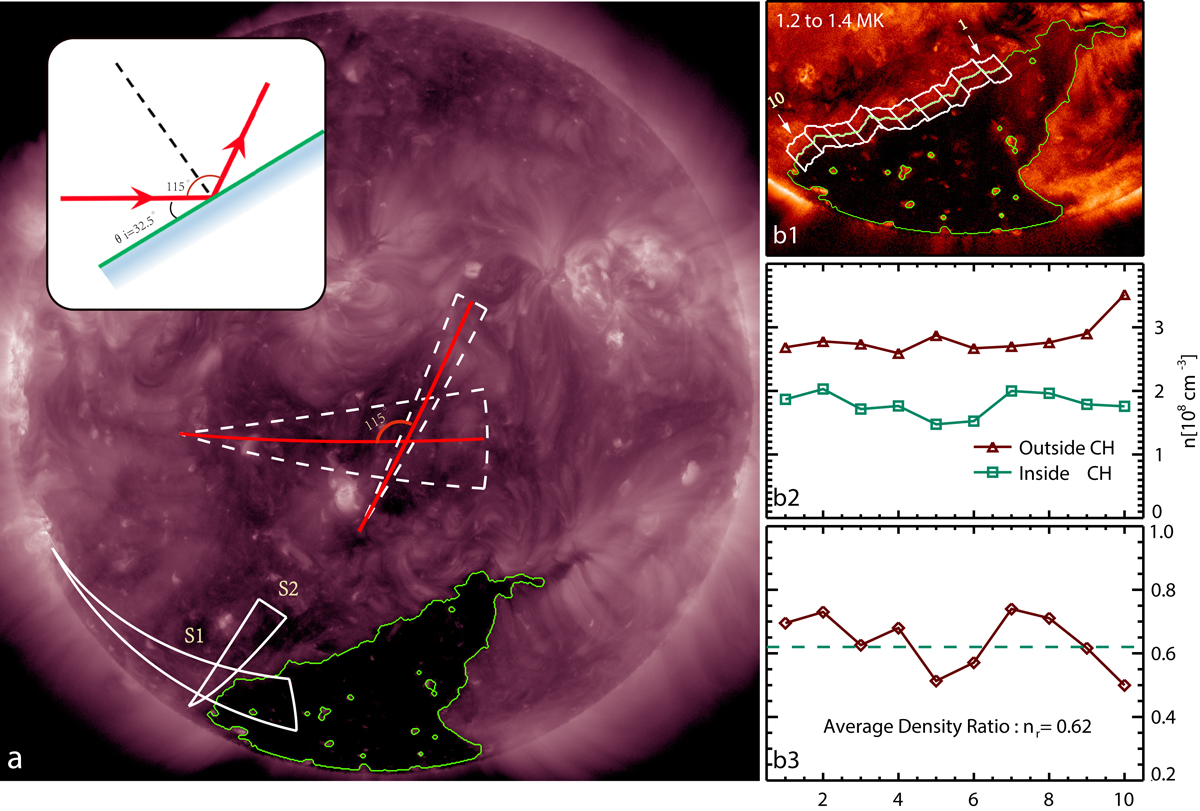
Geometrical properties of the wave trains and the density contrast surrounding the CH boundary. a: AIA 211 Å full-disk images. The green outline represents the CH boundary extracted with the CATCH, and the sectors located on the central disk show the S1 and S2 translation and projection results. b1: plasma total emission measure in the 1.2−1.4 MK temperature range. Twenty patches were selected to estimate the density contrast surrounding the CH boundary, of which ten are inside the CH and ten are outside. b2: density inside and outside the CH shown by, respectively, the green and red lines. b3: plasma density contrast between the inside and outside CH regions.
Current usage metrics show cumulative count of Article Views (full-text article views including HTML views, PDF and ePub downloads, according to the available data) and Abstracts Views on Vision4Press platform.
Data correspond to usage on the plateform after 2015. The current usage metrics is available 48-96 hours after online publication and is updated daily on week days.
Initial download of the metrics may take a while.