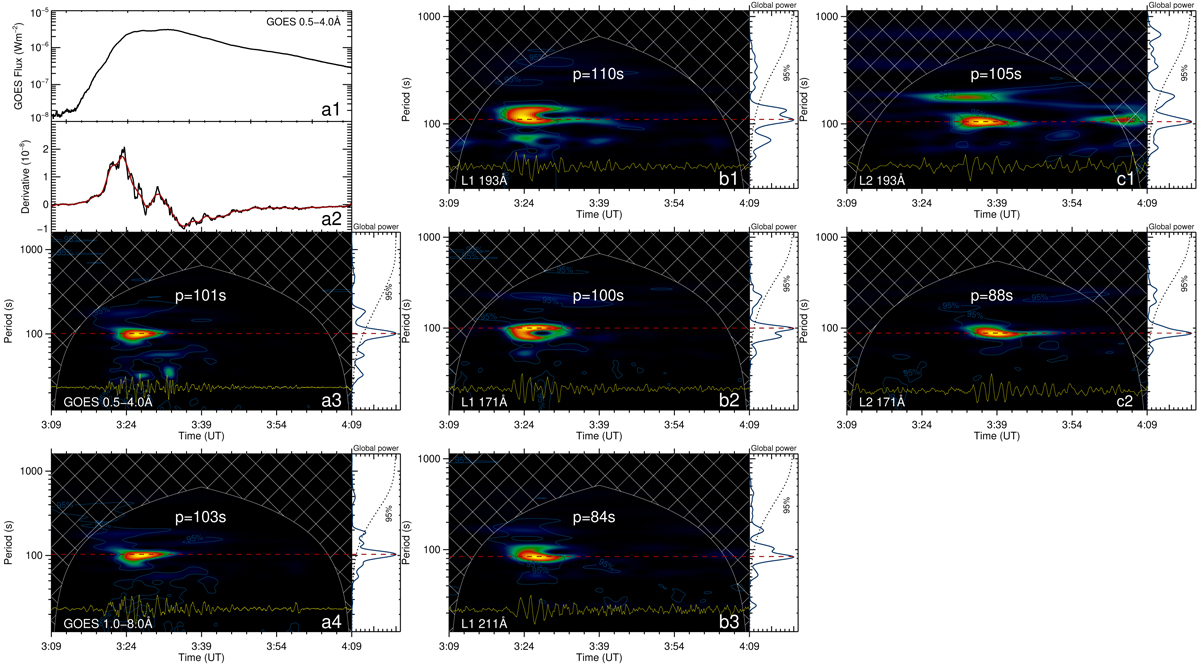
Fig. 4.
Download original image
Periodicity analysis for the wave train and the associated flare pulsation. Panels a1 and a2: GOES 0.5−4.0 Å soft X-ray flux and its temporal derivative (black curve in panel a2), respectively. The detrended intensity profile (yellow curve in panel a3) is obtained from the temporal derivative in panel a2 by subtracting its smoothed intensity profile (red curve in panel a2). The smooth and detrended derivative signal of the GOES 1.0−8.0 Å soft X-ray flux is overlaid in panel a4. The yellow curves in panels b1–c2 are smooth and detrended intensity profiles of the horizontal dashed white lines labeled “L1” and “L2” in Fig. 3, and their corresponding wave wavelet power spectra are displayed in each panel. The cross-hatched regions in panels a3–c2 indicate the cone of influence region due to the edge effect of the data, while the dotted and horizontal dashed red lines mark the 95% confidence level and the period, respectively.
Current usage metrics show cumulative count of Article Views (full-text article views including HTML views, PDF and ePub downloads, according to the available data) and Abstracts Views on Vision4Press platform.
Data correspond to usage on the plateform after 2015. The current usage metrics is available 48-96 hours after online publication and is updated daily on week days.
Initial download of the metrics may take a while.