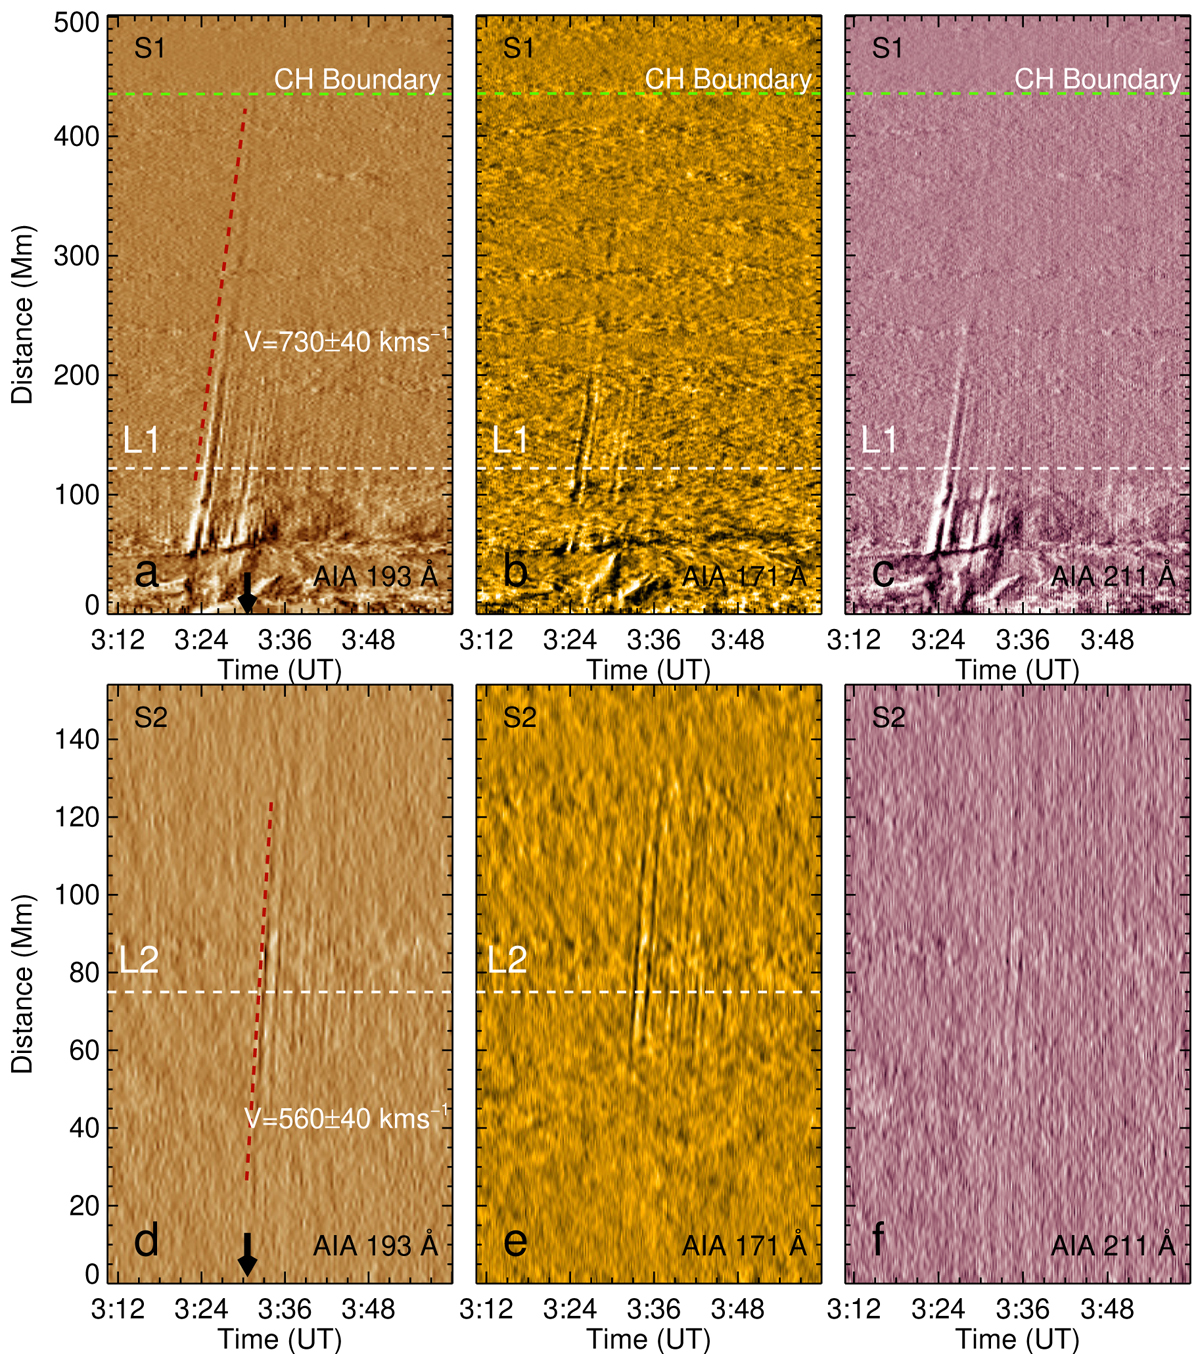
Fig. 3.
Download original image
Time-distance stack plots obtained from AIA 193 Å, 171 Å, and 211 Å running-difference images along sectors S1 (top) and S2 (bottom), as shown in Fig. 1b. The horizontal dashed lines indicate the positions for extracting signals for wavelet analysis, whereas the oblique dotted red lines depict the linear fitting results for estimating the speeds of wavefronts. The dashed green lines in the top panels represent the boundary of the southern polar CH.
Current usage metrics show cumulative count of Article Views (full-text article views including HTML views, PDF and ePub downloads, according to the available data) and Abstracts Views on Vision4Press platform.
Data correspond to usage on the plateform after 2015. The current usage metrics is available 48-96 hours after online publication and is updated daily on week days.
Initial download of the metrics may take a while.