Fig. 8
Download original image
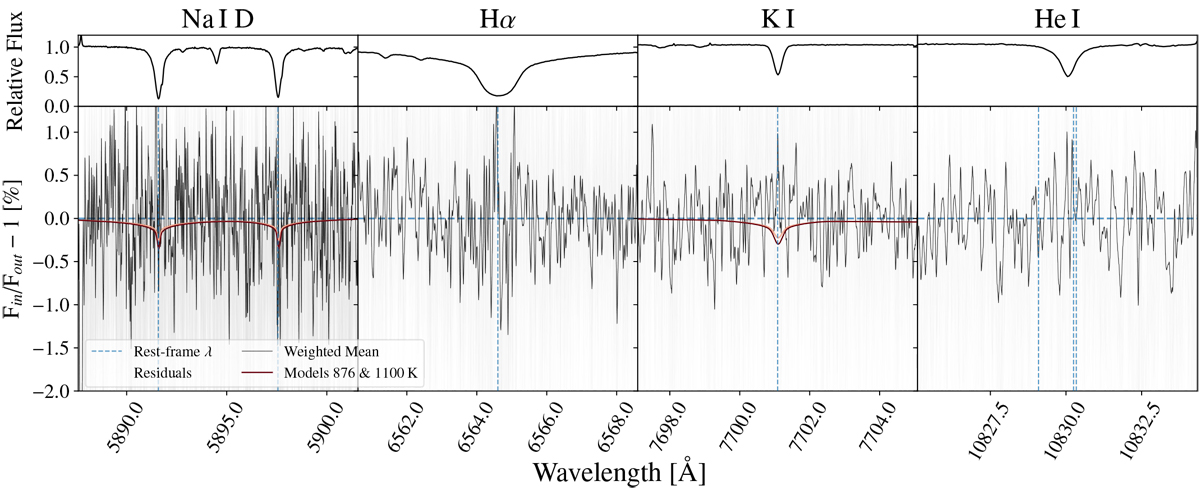
Narrowband transmission spectroscopy of strong transition lines. The upper panels present the composite out of transit stellar spectrum. We note that, with the exception of He I, all the absorption lines present in the stellar spectrum correspond to the species being probed, labelled above each column. The bottom panels present the transmission spectra. The thin grey lines are the individual in-transit residuals shifted to the planetary rest frame. The black lines are the weighted mean of all those shifted residuals. The rest-frame wavelength of each individual transition probed are indicated with vertical blue dashed lines. For Na and K, two atmospheric models of solar metallicity and C/O, with equilibrium temperatures of 876 and 1100 K have been over plotted.
Current usage metrics show cumulative count of Article Views (full-text article views including HTML views, PDF and ePub downloads, according to the available data) and Abstracts Views on Vision4Press platform.
Data correspond to usage on the plateform after 2015. The current usage metrics is available 48-96 hours after online publication and is updated daily on week days.
Initial download of the metrics may take a while.